U.S. Core Durable Good Orders very bad but U.S. GDP higher than expected.
German Manufacturing was, again, better than expected, consistently confirming a long positive trend.
Eurozone private sector growth held steady at a six year high in May, indicating that the economic recovery in the bloc is deepening.
U.S. Retail Sales and U.S. Core CPI (Inflation data) were worse than expected, while U.S. Job market is keeping the good pace.
In its spring economic outlook, the ECB raised euro area GDP growth forecast to 1.7% from 1.6%.
The forecast for 2018 growth was 1.8%, unchanged from its winter economic outlook.
Consumer inflation is expected to rise to 1.6% this year from 0.2% in 2016.
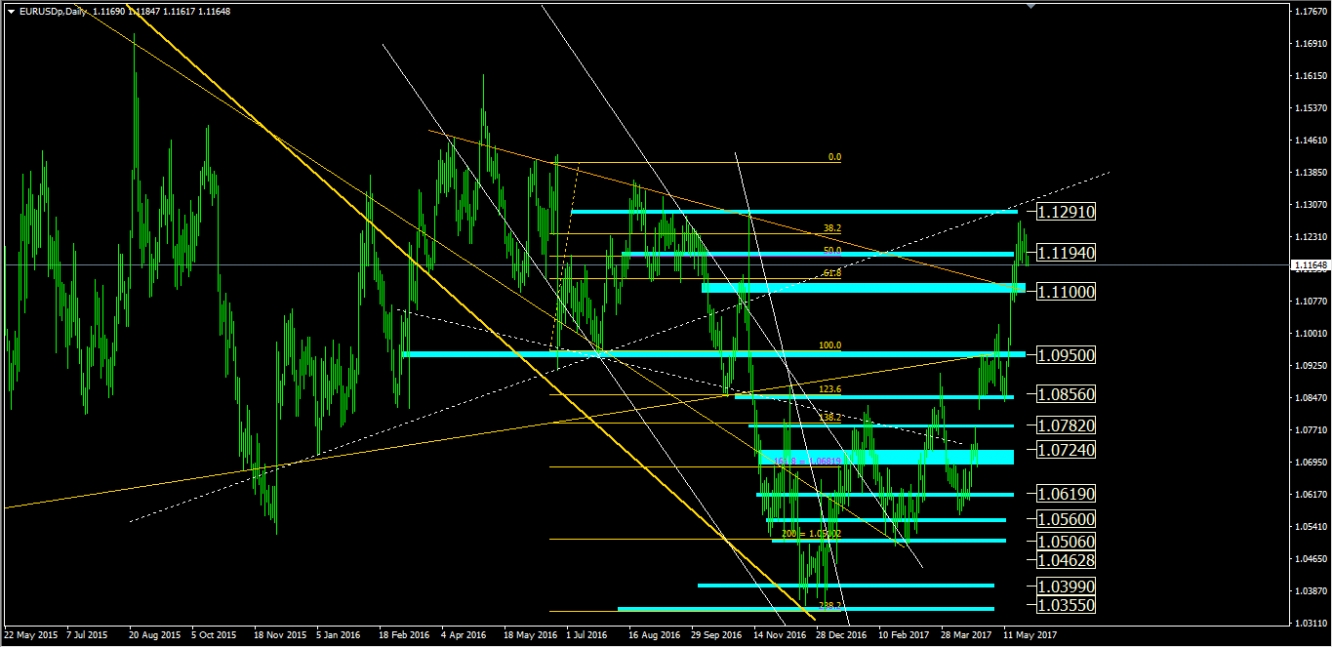
1.119 strong resistance was first broken up for hitting 1.129, then the setup became overbought and now we can expect price to fall down to 1.11, first, and 1.10 (eventually) so to test the strong supports in those areas.
Our special Fibo Retracement is confirming the following S/R levels against the monthly and weekly trendlines obtained by connecting the relevant highs and lows back to 2012:
Weekly Trend: Overbought
1st Resistance: 1.1194
2nd Resistance: 1.1291
1st Support: 1.1100
2nd Support: 1.0950
EUR
Recent Facts:
14th of February: German GDP (Preliminary release) + German ZEW Economic Sentiment + Eurozone GDP (Preliminary release)
German GDP worse than expected, German ZEW worse than expected, Eurozone GDP worse than expected.
15th of February, Eurozone Trade Balance
Better than expected.
21st of February, German Manufacturing PMI
Better than expected.
23rd of February, German GDP
Worse than expected.
1st of March, German Manufacturing + German Unemployment Change
German Manufacturing worse than expected, German Unemployment Change better than expected.
2nd of March, Eurozone Inflation data
In line with expectations.
3rd of March, German Services PMI + Eurozone Retail Sales
Worse than expected.
7th of March, Germany Factory Orders
Worse than expected.
8th of March, German Industrial Production
Better than expected.
9th of March, ECB Interest Rate decision + ECB Press Conference
Interest Rates unchanged, ECB President Dovish (can be cut again in the future if necessary).
14th of March, German CPI + German ZEW Economic Sentiment
German CPI as expected, German ZEW worse than expected.
24th of March, German Manufacturing PMI
Significantly better than expected.
30th of March, German CPI
Lower than expected.
31st of March, German Unemployment Change + Eurozone CPI
German Unemployment Change better than expected (for the sixth time in a row), Eurozone CPI worse than expected.
3rd of April, German Manufacturing PMI
As expected.
11th of April, German ZEW Economic Sentiment
Better than expected.
21st of April, French Manufacturing PMI + German Manufacturing PMI
Better than expected.
23rd of April, French Elections (first round)
Centrist Emmanuel Macron, a pro-EU ex-banker and former economy minister, emerged as the leader of the first round of voting and qualified for a May 7 runoff alongside the second-place finisher, far-right leader Marine Le Pen.
24th of April, German Ifo Business Climate
Better than expected.
27th of April, ECB Interest Rate decision + ECB Press Conference
Unchanged, eyes on next Inflation data.
28th of April, CPI (Preliminary)
Higher than expected.
2nd of May, German Manufacturing PMI
As expected.
3rd of May, German Unemployment Change + Eurozone GDP (Preliminary)
German Unemployment Change better than expected (for the 5th time in a row).
Eurozone GDP (Preliminary) as expected.
7th of May, French Elections
Centrist pro-EU Macron Won French Elections.
12th of May, German GDP (Preliminary release)
As expected.
16th of May, Eurozone GDP (Preliminary release) + Trade Balance + ZEW Economic Sentiment
Better than expected.
17th of May, Eurozone CPI
As expected.
23rd of May, German Manufacturing PMI
Better than expected.
USD
Recent Facts:
2nd of December: Nonfarm Payrolls + Unemployment Rate
Better than expected.
27th of January, GDP + Durable Good Orders
GDP Significantly worse than expected, Durable Good Orders as expected.
1st of February, ADP Nonfarm Unemployment Change + U.S. Institute for Supply Management Manufacturing
Better than expected (ISM Manufacturing at its highest level since November 2014).
3rd of February, Nonfarm Payrolls + Unemployment Rate
Nonfarm Payrolls better than expected, Unemployment Rate worse than expected.
14th of February, Producer Price Index (PPI)
Better than expected.
15th of February, Core CPI (Consumer Price Index) + Retail Sales
Better than expected.
16th of February, Building Permits + Initial Jobless Claims + Philadelphia Fed Manufacturing Index
Better than expected.
21st of February, Manufacturing PMI + Services PMI
Worse than expected.
27th of February, Core Durable Good Orders + Pending Home Sales
Worse than expected.
28th of February, GDP (Preliminary release)
Worse than expected.
3rd of March, ISM Non-manufacturing PMI + Fed Chair Yellen Speech
ISM Non-manufacturing PMI better than expected, Yellen noted that a rate increase at next meeting "would likely be appropriate" insisting on the condition that data on employment and inflation have to move in line with expectations.
8th of March, ADP Nonfarm Employment Change
Better than expected.
10th of March, Nonfarm Payrolls + Unemployment Rate
Better than expected.
14th of March, Producer Price Index
Higher than expected.
15th of March, Core CPI + Retail Sales
As expected.
15th of March, FOMC Economic Projections + FOMC Statement + Fed Interest Rate Decision + FOMC Press Conference
The Federal Reserve increased interest rates by 0.25% to a 0.75-1% range. Dovish speech of Chairwoman Yellen.
24th of March, Manufacturing PMI + Services PMI (preliminary release)
Worse than expected (4th time in a row).
28th of March, Conference Board Consumer Confidence
Better than expected (the highest since December 2000).
30th of March, GDP
Better than expected.
5th of April, ADP Nonfarm Employment Change + ISM Non-Manufacturing Employment + ISM Non-Manufacturing PMI
ADP Nonfarm Employment Change Better than expected.
ISM Non-Manufacturing Employment + ISM Non-Manufacturing PMI worse than expected.
7th of April, Nonfarm Payrolls + Unemployment Rate
Nonfarm Payrolls worse than expected, Unemployment Rate better than expected.
14th of April, Core CPI + Retail Sales
Core CPI (Inflation) lower than expected.
Retail Sales worse than expected.
20th of April, Philadelphia Fed Manufacturing Index
Worse than expected.
27th of April, Durable Good Orders + Pending Home Sales
Worse than expected.
28th of April, GDP (Preliminary release)
Worse than expected but Price Index higher than expected.
3rd of May, ADP Nonfarm Employment
ADP Nonfarm Employment better than expected.
5th of May, Nonfarm Payrolls + Unemployment Rate
Better than expected.
11th of May, U.S. Producer Price Index (PPI)
Higher than expected.
12th of May, U.S. Retail Sales + Core CPI (Inflation data)
Worse than expected.
18th of May, Initial Jobless Claims + Philadelphia Fed Manufacturing Index
Better than expected.
23rd of May, Manufacturing PMI + New Home Sales
Worse than expected.
24th of May, FOMC Meeting Minutes
U.S. central bank kept its benchmark rate unchanged, highlighting a slowdown in economic activity (more proof that weakness in the first-quarter was temporary is needed for future rate hikes).
26th of May, Core Durable Good Orders + U.S. GDP (Preliminary release)
Core Durable Goods Orders worse than expected, GDP (Preliminary) better than expected.
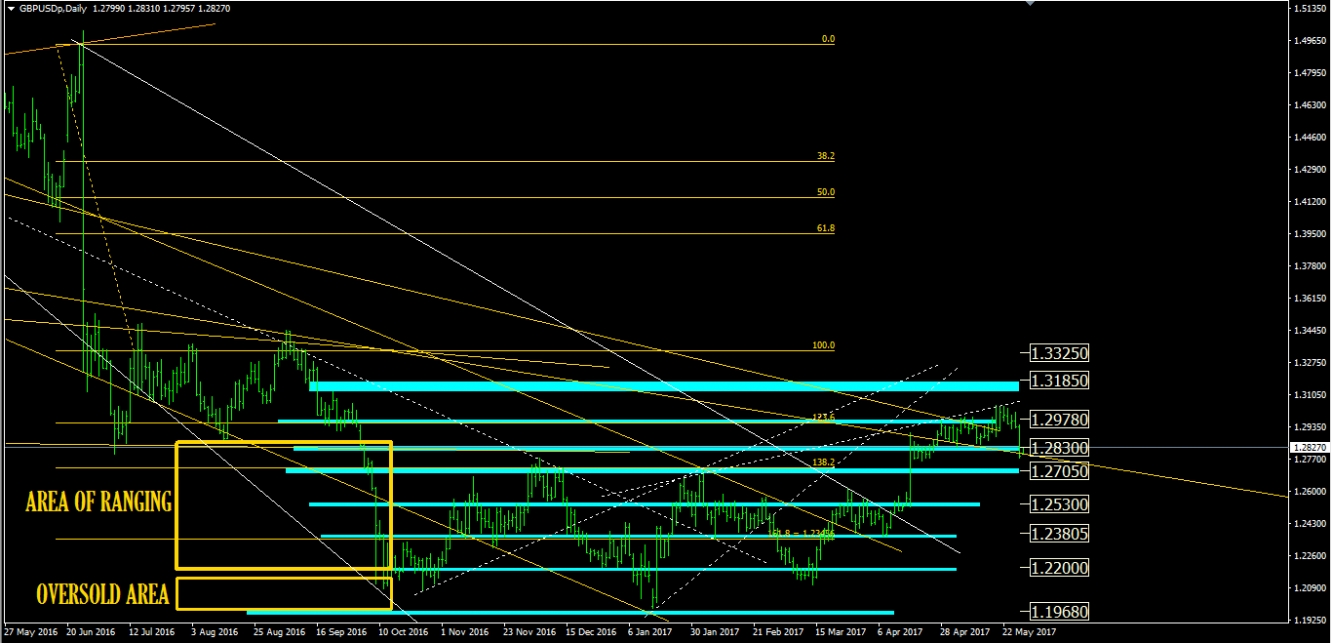
As we wrote in the previous commentaries, possibilities to get down to 1.28 area are high in the case of expected bad news from the UK and that is what is happening after test of resistances close to 1.30 area: first stop in area 1.283.
UK GDP, Preliminary release, worse than expected, for the second time in a row. On the other hand, U.S. GDP was higher than expected.
Last UK Inflation (CPI) print was higher than expected and gave recently some vitality to GBP but the Bank of England made no changes to monetary policy at the outcome of its last meeting. Left interest rates on hold at current record lows and warned that living standards will fall this year as the headwinds from Brexit mount.
And there are still some unresolved tensions with Scotland and Northern Ireland, which voted against leaving the EU. Theresa May provided no clear plan about the comprehensive “free-trade” partnership with EU members she wants to achieve.
Theresa May called for early general elections on June 8. She said Britain needed a strong and stable leadership going into Brexit, but election gap between Labor and Conservative looks tightening and this leaves some doubts about future Brexit setups.
Our special Fibo Retracement is confirming the following S/R levels against the monthly and weekly trendlines obtained by connecting the relevant highs and lows back to 2001:
Weekly Trend: Bearish
1st Resistance: 1.2978
2nd Resistance: 1.3185
1st Support: 1.2830
2nd Support: 1.2705
GBP
Recent Facts:
4th of August, Bank of England Interest Rates decision (expected a cut)
Bank of England lowers Interest Rates as expected (record low of 0.25%) and increases purchase program.
20th of January, Retail Sales
Worse than expected.
26th of January, GDP (Preliminary release)
Better than expected.
2nd of February, Construction PMI
Worse than expected.
3rd of February, Services PMI
Worse than expected.
10th of February, Manufacturing Production
Better than expected.
14th of February, Consumer Price Index (CPI)
Worse than expected.
15th of February, Job Market
Better than expected.
17th of February, Retail Sales
Worse than expected.
1st of March, Manufacturing PMI
Worse than expected.
2nd of March, Construction PMI
Better than expected.
3rd of March, Services PMI
Worse than expected.
10th of March, Manufacturing Production + Trade Balance
UK Manufacturing Production worse than expected, Trade Balance better than expected.
15th of March, Job Market
Better than expected.
16th of March, Interest Rates Decision + BoE Meeting Minutes
A Bank of England policymaker unexpectedly voted to raise interest rates.
21st of March, CPI
CPI Higher than expected.
23rd of March, Retail Sales
Better than expected.
31st of March, GDP YoY
Worse than expected.
3rd of April, Manufacturing PMI
Worse than expected.
5th of April, Services PMI
Better than expected.
7th of April, Manufacturing Production
Worse than expected.
11th of April, UK CPI
Higher than expected.
12th of April, UK Job Market
Worse than expected.
21st of April, UK Retail Sales
Worse than expected.
28th of April, UK GDP (Preliminary release)
Worse than expected.
2nd of May, Manufacturing PMI
Better than expected.
3rd of May, Construction PMI
Better than expected.
4th of May, Services PMI
Better than expected.
11th of May, UK Manufacturing Production + Trade Balance + BoE Interest Rate Decision
Manufacturing Production + Trade Balance worse than expected.
The Bank of England made no changes to monetary policy but warned that living standards will fall this year as the headwinds from Brexit mount.
16th of May, UK CPI (Inflation data)
Higher than expected.
17th of May, UK Job Market
Worse than expected.
18th of May, Retail Sales
Better than expected.
25th of May, GDP (Preliminary)
Worse than expected.
USD
Recent Facts:
See above.
Eyes on today Building Approvals and Private House Approvals.
U.S. GDP higher than expected but U.S. central bank kept its benchmark rate unchanged, highlighting a slowdown in economic activity (more proof that weakness in the first-quarter was temporary is needed for future rate hikes).
Moody's Investors Service downgraded China's credit rating to A1 from Aa3, changing its outlook to stable from negative, citing expectations that China's financial strength will erode somewhat over the coming years.
Oil prices moving sharply lower after OPEC decided to extend production cuts by nine months to March 2018.
Australia Employment Change better than expected (it is the 5th time over the last 6 months) but Australia Retail Sales worse than expected.
Last U.S. Retail Sales and U.S. Core CPI (Inflation data) worse than expected. Also U.S. house market is showing softness, but U.S. Job market keeps consistently the good pace.
In the last meeting, the Reserve Bank of Australia held Interest Rates at 1.5% as expected signalling that further interest rate cuts were off the table as wage gains are weaker than hoped, though house prices in some markets remain a worry.
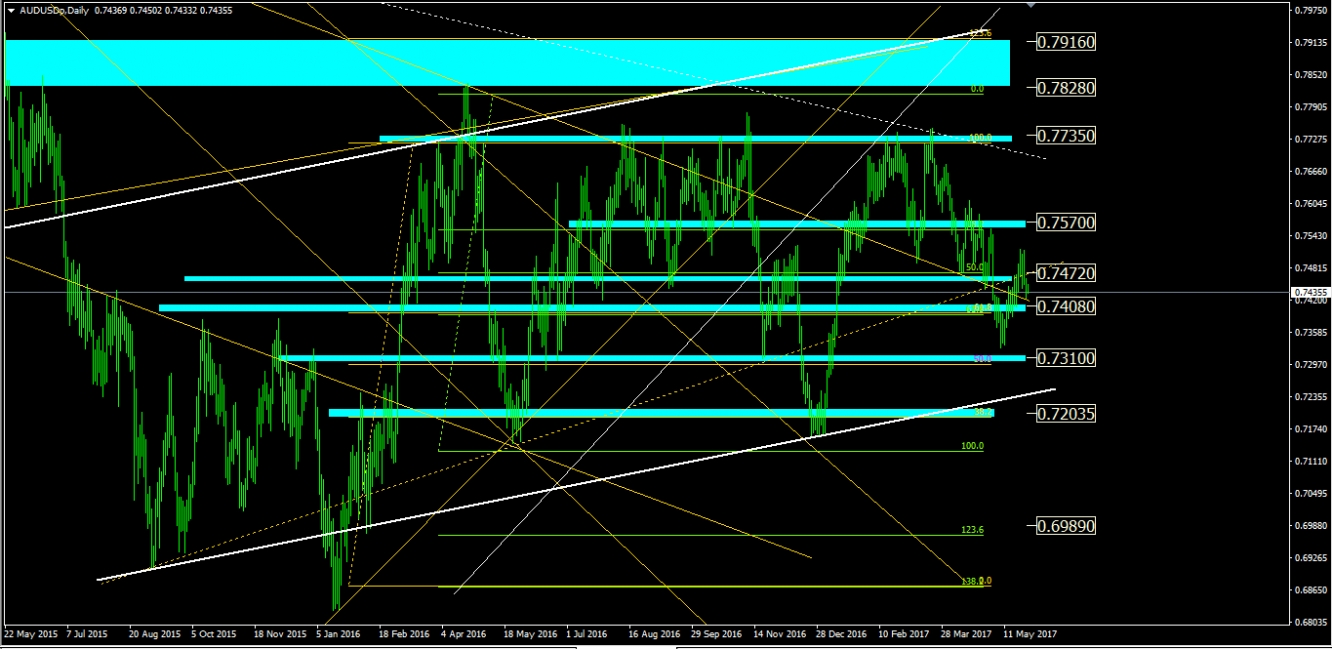
As we wrote, Resistance in 0.742 area worked, and if the very important Support in area 0.7408 failed then we would see AUD/USD falling down to 0.73 area.
Our special Fibo Retracements are confirming the following S/R levels against the monthly and weekly trendlines obtained by connecting the relevant highs and lows back to 2012:
Weekly Trend: Bearish
1st Resistance: 0.7472
2nd Resistance: 0.7570
1st Support: 0.7408
2nd Support: 0.7310
AUD
Recent Facts:
1st of November, RBA Interest Rates Statement
RBA’s Governor Lowe signals tolerance for weak inflation and bets seem off for future rate cuts.
3rd of November, RBA Monetary Policy Statement + Retail Sales
RBA said it is focused on the medium-term inflation target.
Retail Sales better than expected.
8th of November, ELECTION OF THE 45th PRESIDENT OF THE UNITED STATES
Donald Trump elected President.
9th of November, Reserve Bank of New Zealand Interest Rate Decision + Monetary Policy Statement
Interest Rates cut to 1.75% from 2.00% as expected.
19th of December, Mid-Year Economic and Fiscal Outlook
Scott Morrison announced lower than an original prediction of A$37.1 billion, investors see it as promising to stave off a downgrade of its AAA (triple A) rating from S&P Global.
9th of January, Retail Sales
Worse than expected.
19th of January, Employment Change
Better than expected.
25th of January, CPI (Consumer Price Index measures the change in the price of goods and services from the perspective of the consumer)
Lower than expected.
1st of February, AIG Manufacturing Index
Worse than expected.
2nd of February, Building Approvals + Trade Balance
Better than expected.
7th of February, RBA Interest Rates Decision + RBA Rate Statement
RBA held steady as expected at a record low 1.50%, while noting better economic conditions with China.
8th of February, New Zealand Interest Rate Decision + RBNZ Monetary Policy Statement
Interest Rates Unchanged and RBNZ’s agenda contains no changes for 2017.
16th of February, Employment Change
Better than expected.
28th of February, New Home Sales, Current Account, Private Sector Credit.
1st of March, Australia GDP
Better than expected.
16th of March, Employment Change + Unemployment Rate
Worse than expected.
2nd of April, Retail Sales
Worse than expected.
4th of April, RBA Interest Rate Decision
Interest Rates unchanged, as expected. Dovish tone in Philip Dowe’s Speech.
9th of April, Home Loans
Worse than expected.
13th of April, Australia Employment Change
Better than expected.
18th of April, RBA Meeting Minutes
Dovish.
26th of April, Australia CPI
Lower than expected.
2nd of May, RBA Interest Rate Statement
RBA holds Rates at 1.5%.
4th of May, Australia New Home Sales + Trade Balance
Worse than expected.
9th of May, Australia Retail Sales
Worse than expected.
18th of May, Australia Employment Change
Better than expected.
24th of May, Australia Construction Work Done
Worse than expected.
24th of May, Moody’s Credit Rating on China
Moody's Investors Service downgraded China's credit rating to A1 from Aa3, changing its outlook to stable from negative.
25th of May, OPEC Meeting
OPEC decided to extend production cuts by nine months to March 2018.
Eyes on today release: Building Approvals + Private House Approvals.
USD
Recent Facts:
See above.


