
Based in Beijing, China, Momo Inc (NASDAQ:MOMO) operates a mobile-based social and entertainment platform. The company was founded in 2011 and became public in late-2014. The Tinder of China, as Momo is often referred to, first turned a profit in 2015 and has been enjoying strong earnings and revenue growth in the last three years.
Momo the stock, on the other hand, has been rather disappointing lately. It climbed to over $54 a share in June 2018, only to come back down to $22.85 this January. That ~57% can make investors think there is something wrong with the company. In reality, 2019 is expected to be another record-breaking year in terms of business results for Momo.
Unfortunately, those who relied only on the improving fundamentals and bought above $50 a share have a huge loss to show for it. In order to learn from their mistake, let’s add the Elliott Wave principle to the equation and see if it supports the positive outlook.
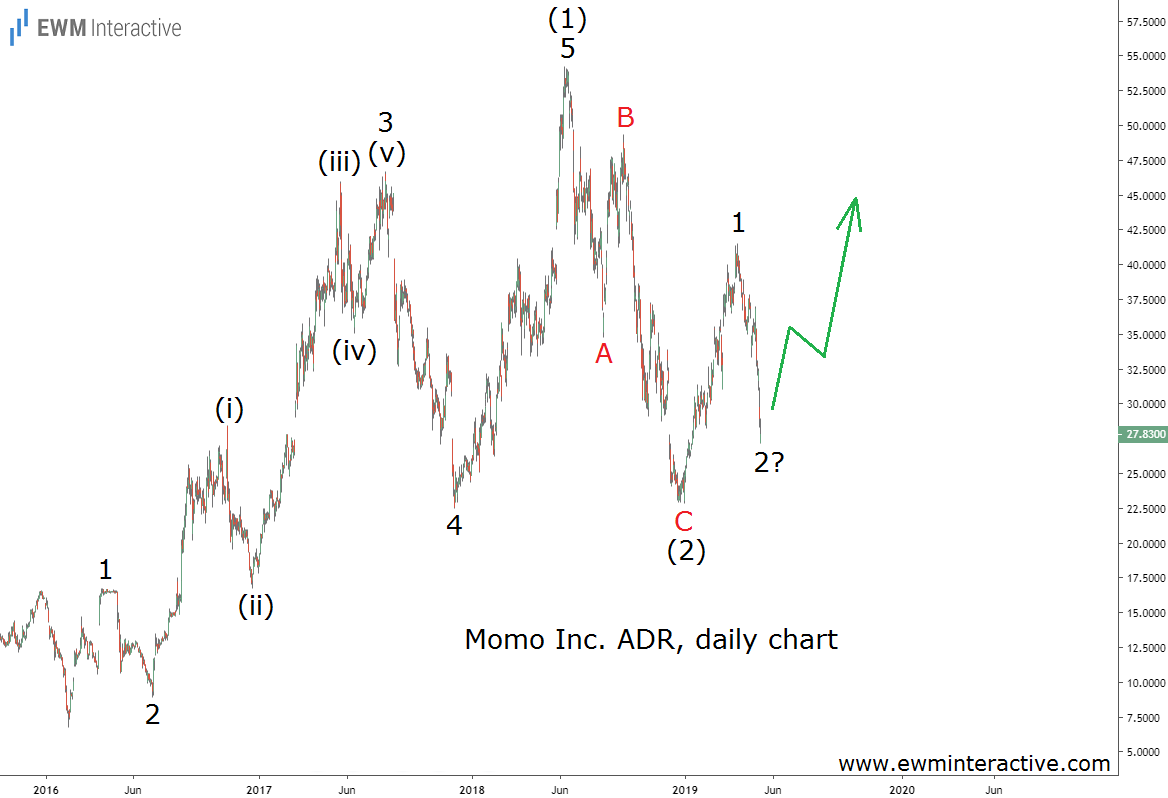
The daily chart of Momo stock reveals that the structure of the rally from $6.72 in February 2016 is impulsive. It is labeled 1-2-3-4-5, where the sub-waves of wave 3 are also visible. Wave 4 is significantly bigger than wave 2 and while not pretty, this doesn’t violate any Elliott Wave rules.
Momo’s Chart Points North
According to the theory, a three-wave correction in the other direction follows every impulse. Here, once wave 5 ended at $54.24 it was time for the bears to take the baton. Six months later, Momo had already lost more than half of its market cap. The decline to $22.85 is shaped as a simple A-B-C zigzag.
If this count is correct, the bullish 5-3 wave cycle is complete and it is now time for Momo stock to head north again. Regulatory pressure and trade war fears remain, but when charts and fundamentals align, it often pays to take a risk.