As an options trader, I am looking for momentum in charts and technicals, mostly for individual stocks but also for indices. I want to see powerful moves occur, ideally getting on board just before these surges happen. But that might be considered market timing, right? I try to dodge the label of market timer at all times, it's just a failing strategy. Nobody can predict behavior and nobody can time markets precisely right every time.

But what about momentum? How can we see/feel the market surges and turn that into a good trade? There are some very useful tools that show us how strong momentum is, and applying the logic of prior patterns and predictable human behavior we can come up with a strong thesis and go with it. This is all with the understanding that nothing is perfect, and that any event in the future can certainly invalidate a thesis. All things being equal, going with the strength of the market tide can be a profitable venture.
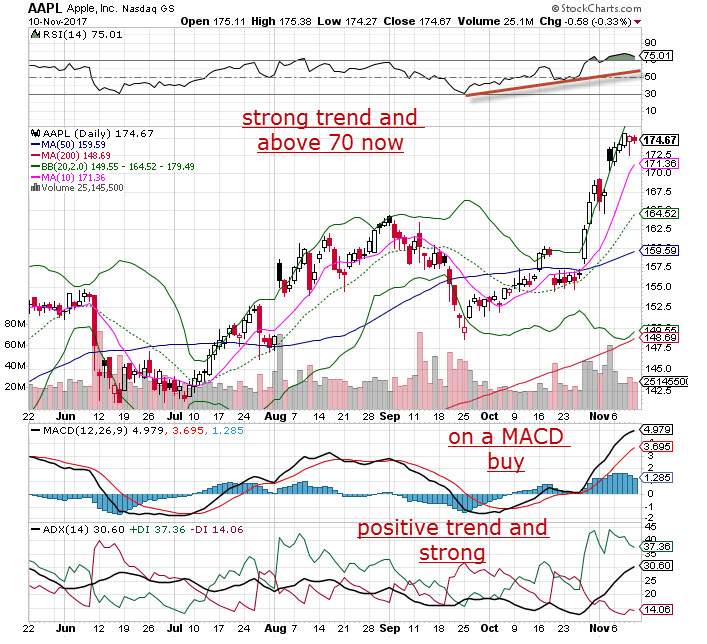
Momentum is like a long wave in the ocean. We look to ride it out as long as possible, with the understanding that we won't try and predict when it ends. But we can certainly see it happening just by looking at charts and indicators. While there are a slew of indicators created that show momentum from different angles, I prefer to use some of the traditional gauges. The chart below of Apple (NASDAQ:AAPL) shows some of the tools I like to use.
I like to start with the relative strength index, or RSI. This is a graphic representation that tells how a particular stock is doing price-wise versus an index. It was developed years back by famed technician Welles Wilder to measure the speed and change of price movements. If you're a believer in momentum moves continuing on, then the RSI is a must use tool to use. I use a 14 period indicator and look for higher lows and higher highs, and eventually an embedded reading that sticks above 70 for a period of time.
The MACD is a great predictor tool that shows a change in the stock's trajectory before it occurs, not during or after. I use the standard 12 26 9 settings and look for crossovers on the histogram. Whether the momentum is up or down, this tool is valuable in helping to identify a trend before it happens.
Finally, I like to use the ADX, or the average directional movement. Another indicator created by Welles Wilder, this tool shows us the strength of a price trend by considering both positive and negative directional movements. The ADX is an average of the two, and the stronger the ADX over a 14 period (my setting) the higher quality and longer lasting the trend will be. I look for readings above 25 on the ADX, which tells me that trend (not direction) is particularly strong and may last for quite some time.
Technical tools give you the facts about a stock's movement, and identifying the best momentum names can be a profitable experience. While there are many to choose from, most give the same information but in different forms. Use these to compliment other tools in your analysis toolbox.