
Global brewer Molson Coors Brewing Company (NYSE:TAP) reported dismal results in the first quarter of 2017, after posting weaker-than-expected numbers in the fourth quarter of 2016.
Molson Coors’ adjusted earnings of 76 cents were way behind the Zacks Consensus Estimate of $1.31 per share by 42% and also declined 12.6% from the prior-year earnings of 87 cents.
Earnings declined on a year-over-year pro forma basis due to higher brand amortization expense, mix shift to higher-cost products, and weaker volumes in the U.S. in January and February. Lower income in the U.S. and Canada also led to the decline in the quarter.
Revenues and Operating Profits
Net sales, including excise tax, dipped 0.5% year over year to $2.45 billion in the first quarter of 2017. Sales marginally lagged the Zacks Consensus Estimate of $2.47 billion by 0.8%. While sales declined in Europe and U.S., the Canada and International regions witnessed an improvement in the same. Currency had a negative impact of $36.2 million on overall sales in the quarter. On a constant currency basis, sales increased 1.0%.
Molson Coors’ worldwide brand volume grew 2.1% to 19.7 million hectoliters in the first quarter, whereas financial volume of 21.9 million hectoliters decreased 2.8% versus the prior year.
We note that worldwide brand volume continues to exclude contract brewing and wholesaler non-owned brand volumes, and includes 100% of MillerCoors brand volumes and royalty volumes. Financial volume includes contract brewing and wholesaler non-owned brand volumes.
Underlying EBITDA was $514.9 million in the first quarter, a decline of 3.6% from the year-ago period due to higher corporate costs, declines in Canada and MillerCoors and currency headwinds, partially offset by growth in Europe. Further, underlying EBITDA on a constant-currency basis remained unchanged from the year-ago figure.
Molson Coors Brewing Company Price, Consensus and EPS Surprise
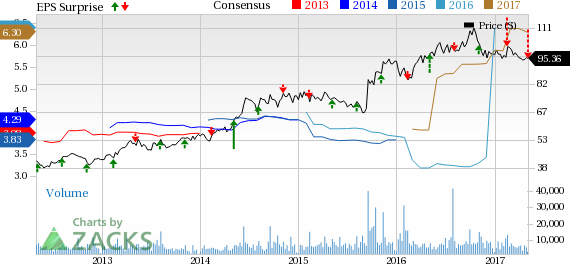
Molson Coors Brewing Company Price, Consensus and EPS Surprise | Molson Coors Brewing Company Quote
Segment Details
The company operates through the following geographical segments.
Canada: Molson Coors Canada net sales increased 8.6% to $291.1 million in the quarter driven by higher volumes and favorable currency impact. On a constant currency basis, segment sales increased 5.1%.
Net sales per hectoliter surged 3.9% in local currency, driven primarily by positive pricing and brand mix. Canada brand volume inched up 0.7%, while financial volume grew 1.1% in the quarter.
The segment’s underlying pre-tax income declined 64.3% to $13.3 million. Currency positively impacted income by $0.3 million.
United States (MillerCoors): On Oct 12, 2016, Molson Coors completed the acquisition of remaining 58% stake in the MillerCoors’ joint venture, along with the Miller global brand portfolio. It now has complete ownership rights to all the brands in the MillerCoors portfolio for the U.S. market, including Redd’s and other import brands such as Peroni and Pilsner Urquell.
Domestic net revenue per hectoliter, which excludes contract brewing and company-owned-distributor sales, improved marginally by 0.2% in the quarter, owing to favorable pricing, partially offset by negative sales mix. However, both U.S. domestic sales-to-retailers volume (STRs) and domestic sales-to-wholesalers volume (STWs) declined 2.0% and 4.0%, respectively in the quarter.
First quarter pre-tax income increased 3.4% to $315.6 million when compared to the year-ago figure, driven by lower merger expenses and higher net pricing growth, partially offset by lower volume and higher costs.
Europe: The segment reported net sales growth of 6.4% or $381.6 million in the first quarter of 2017, driven by higher volumes, offset by unfavorable currency impact of $53.7 million. On a constant currency basis, segment sales surged 19.1%. Europe net sales per hectoliter grew 16.3% in local currency driven by positive mix, partially offset by lower net pricing. While Europe brand volume increased 9.6% in the first quarter, financial volume inclined 2.3%.
Europe’s underlying pre-tax results increased to $33.4 million from the year-ago decline of $0.5 million. Currency negatively impacted the underlying results by $9.2 million.
Molson Coors International (MCI): Segment net sales grew significantly by 99.4% to $61.8 million in the quarter. On a constant currency basis, segment sales increased 99.7%, driven by higher sales volume. Net sales per hectoliter increased 15.2%, driven by sales mix changes and higher pricing. Total International brand volume increased 65.2%in the first quarter, driven by the transfer of the Puerto Rico business from MillerCoors, the addition of the Miller global brands, and Coors Light growth, primarily in Latin America. These factors were partially offset by the transfer of royalty and export brand volume to Europe.
The International segment’s underlying pre-tax income was $2.7 million in the first quarter, versus a loss of $2.3 million a year ago. Foreign currency movements positively impacted underlying pre-tax results by $0.3 million in the quarter.
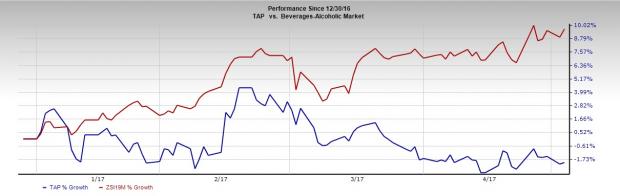
Molson Coors’ shares declined 2.0% on a year-to-date basis in comparison to the Zacks categorized Beverages-Alcohol industry’s growth of 9.7%. Notably, the industry is part of the bottom 40% of the Zacks Classified industries (160 out of the 265).
Other Financial Update
Total debt at the end of the first quarter was $12.3 billion, and cash and cash equivalents totaled $395 million, resulting in net debt of $11.9 billion. Underlying free cash flow was a cash use of $221.3 million during the quarter.
Zacks Rank & Key Picks
Molson Coors currently carries a Zacks Rank #3 (Hold).
Better-ranked stocks in the consumer staple sector include Constellation Brands, Inc. (NYSE:STZ) , ConAgra Foods Inc. (NYSE:CAG) and Lamb Weston Holdings Inc. (NYSE:LW) . While Constellation Brands sports a Zacks Rank #1 (Strong Buy) and has a long-term earnings growth of 17.8%, ConAgra and Lamb Weston carry a Zacks Rank #2 (Buy) each. You can see the complete list of today’s Zacks #1 Rank stocks here.
While ConAgra Foods has a long-term earnings growth rate of 8%, Lamb Weston has a long-term earnings growth rate of 4.2%.
Will You Make a Fortune on the Shift to Electric Cars?
Here's another stock idea to consider. Much like petroleum 150 years ago, lithium power may soon shake the world, creating millionaires and reshaping geo-politics. Soon electric vehicles (EVs) may be cheaper than gas guzzlers. Some are already reaching 265 miles on a single charge.
With battery prices plummeting and charging stations set to multiply, one company stands out as the #1 stock to buy according to Zacks research.
It's not the one you think.
Constellation Brands Inc (STZ): Free Stock Analysis Report
Molson Coors Brewing Company (TAP): Free Stock Analysis Report
ConAgra Foods Inc. (CAG): Free Stock Analysis Report
Lamb Weston Holdings Inc. (LW): Free Stock Analysis Report
Original post
Zacks Investment Research