Celebrated value investor Benjamin Graham, who mentored a young Warren Buffett, liked to say that the market is a voting machine in the short term, a weighing machine in the long term. Last week the market voted to reward stocks in the aftermath of the midterm elections, which gave Democrats control of the House and left the Senate in the hands of Republicans. This all but guarantees that gridlock will be the status quo in Washington, at least for the next two years.
A divided Congress might very well be the only time gridlock is a positive. Corporate gridlock can hold a company back from growing, and there’s not a soul alive who enjoys sitting in bumper-to-bumper traffic. The congestion in Austin, just north of our headquarters, is legendary, costing commuters as much as 43 hours a year. (This congestion could be improved with better infrastructure, which I’ll get to in a second.)
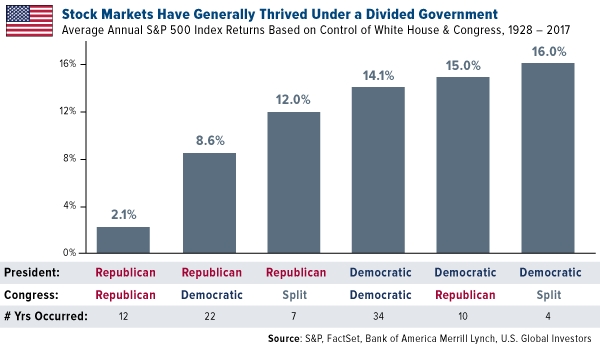
The truth is that markets favor divided government. Both Republican and Democratic presidents have had the greatest effects on stocks when Congress was split and gridlock prevailed, according to Bank of America Merrill Lynch (NYSE:BAC) data. Granted, such leadership makeups are rare, occurring for only a combined 11 years in the past 90, so I’ll be curious to see if the trend holds true.
But in the short term, markets showed a lot of enthusiasm. The S&P 500 Index advanced more than 2 percent on Wednesday, marking the best post-midterm rally since 1982. Stocks got slammed only after the Federal Reserve announced more rate hikes were forthcoming.
I want to remind you that we’ve already entered the three most bullish quarters for stocks in the four-year presidential cycle. Average returns in the fourth quarter of year two have historically been 4 percent, followed by 5.2 percent in the first quarter of year three and 3.6 percent in the second quarter.
Record Votes, Record Campaign Spending
Voter turnout was abnormally high for a midterm election. Here in Texas, nearly 53 percent of registered voters cast ballots—a very strong showing thanks in large part to the much-publicized and heavily funded Senate race between Senator Ted Cruz and Congressman Beto O’Rourke.
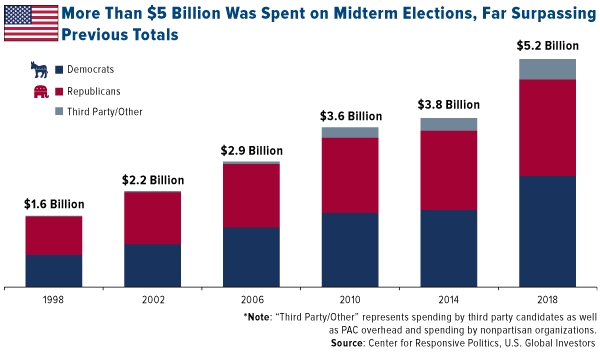
Indeed, a whole lot of cash passed hands this cycle. For the first time in U.S. history, more than $5 billion was spent during a midterm election by candidates, political parties and other groups, according to the Center for Responsive Politics (CRP). That’s up almost 40 percent from spending levels in 2014. The biggest independent donor was billionaire Sheldon Adelson, founder and CEO of Las Vegas Sands, and wife Miriam, who shelled out more than $113 million in support of Republican candidates.
Because it’s such a massive amount, it might help to put $5.2 billion into perspective. An estimated 113 million Americans participated in the midterm election, a new record, meaning roughly $46 was spent on each voter.
Here’s another way to look at it. Between the House and Senate, 470 seats were up for grabs. That comes out to an incredible $11 million per seat.
Big Winners: Infrastructure And Cannabis
Like every election cycle, this one is sure to have some huge consequences—not least of which is House Democrats’ pledge to turn up the heat on President Donald Trump. Representatives Maxine Waters, Adam Schiff, Elijah Cummings and other staunch critics of the president are expected to lead key oversight and intelligence committees that could open investigations into Trump’s finances and handling of White House personnel changes as soon as this January.
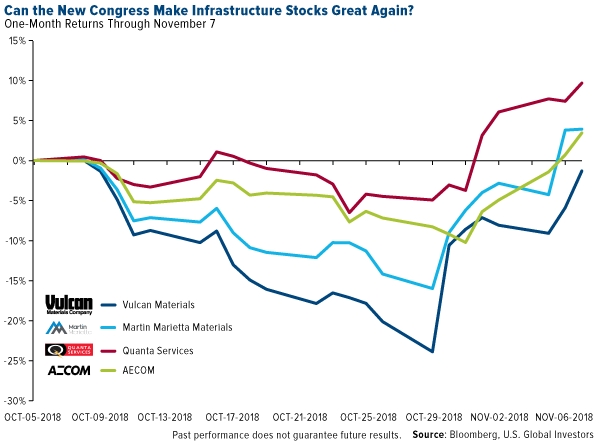
My hope is that Democrats and the president can agree to come together on areas of common interest. That includes infrastructure. Remember the $1 trillion infrastructure plan? Remember “Infrastructure Week”? It’s possible we could finally see a spending bill of some kind, as both the Democrats and Trump support the idea. This would be a massive tailwind for raw materials, commodities and energy.
Materials and construction services stocks—including Vulcan Materials (NYSE:VMC), Martin Marietta Materials (NYSE:MLM), Quanta Services (NYSE:PWR) and AECOM—jumped in response to the election outcome.
As I’ve shared with you before, U.S. infrastructure is badly in need of a spit shine. Last year, the American Society of Civil Engineers (ASCE) gave the country’s roads, bridges and waterways a D+ while noting that there’s a $2 trillion infrastructure funding gap between now and 2025. Because this affects all Americans, it shouldn’t be turned into a partisan issue.
Another winner last week was the U.S. cannabis industry, which is expected to be worth some $75 billion by 2030, according to Cowen & Co., Michigan voted to legalize recreational marijuana, the 10th state to do so, while Missouri and Utah voters approved medical marijuana. Pot stocks, led by Canadian grower and distributor Tilray, surged on the news.
Tilray jumped nearly 6 percent last Tuesday, another 30 percent on Wednesday following the ouster of now-former Attorney General Jeff Sessions. As the head of the Department of Justice, Sessions strongly opposed legalization. Industry advocates hope the next permanent AG will be more open to relaxing federal law.
Oil Notched A 10th Straight Day Of Losses
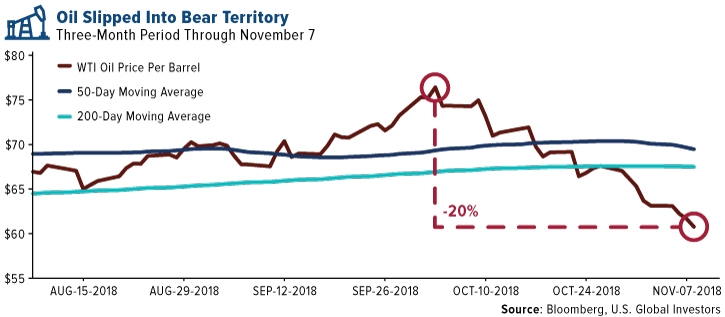
As recently as last month, it didn’t look as if anything could stop oil from heading even higher. Friday, however, marked the 10th straight day of losses for West Texas Intermediate (WTI), as inventories continue to build and the U.S., Russia and Saudi Arabia produce at record or near-record levels.
Down more than 20 percent from its recent high of $76 in early October, oil was trading below $60 a barrel friday and is now considered to be in a bear market.
Although bad news for producers and refiners, lower oil prices are good for nearly everyone else, including net importer countries and airlines. As I told CNBC Asia’s Akiko Fuijita last week, when oil prices have fallen below their 50- and 200-day moving averages, quant traders especially have poured money into airlines.
It’s important to note, too, that demand remains very strong, outpacing capacity growth. According to a report by the International Air Transport Association (IATA) dated October 19, airline passenger load factor climbed to a 28-year high in August. Global load factor, a measure of an airline’s capacity usage, rose to 85.3 percent for the first time since 1990.
All opinions expressed and data provided are subject to change without notice. Some of these opinions may not be appropriate to every investor. By clicking the link(s) above, you will be directed to a third-party website(s). U.S. Global Investors does not endorse all information supplied by this/these website(s) and is not responsible for its/their content.


