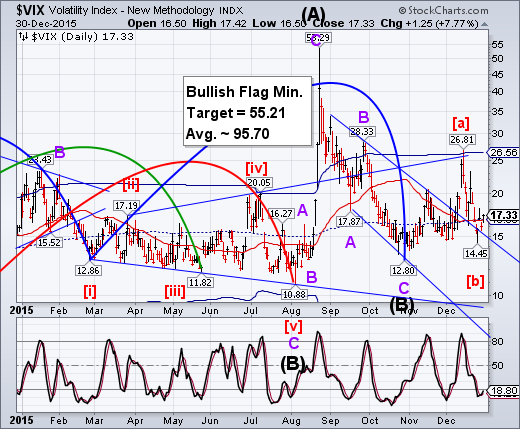
VIX rose above its mid-Cycle resistance at 16.83, putting it back on a buy signal. The attempts to close with a positive year in equities may be losing traction..
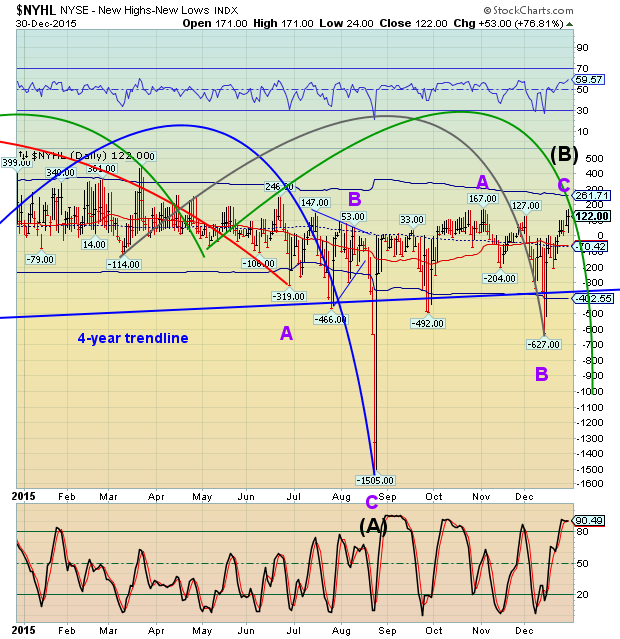
The NYSE Hi-Lo Index rallied to its highest price since June. This is due to an effort to elevate stock prices into the year-end. The latest high may be considered a false breakout, rather than a buy signal.
(ZeroHedge) Earlier today, we noted that while the market was surging last week, the smart money was selling. This comes at the same time as ICI reported major redemptions from both stock ($3.9 billion) and bond ($4.5 billion) mutual funds, even as corporate buybacks were decelerating, leading to the question of just who was buying stocks during the Santa rally of the past two weeks.
But something even more surprising emerged when looking at the detailed breakdown of how the "smart money" has been flowing. As Bank of America (N:BAC) clarifies, when explaining where its $0.7 billion in weekly outflows came from, "net sales were chiefly due to institutional clients last week" and adds that institutionals "have sold stocks for eight consecutive weeks!"
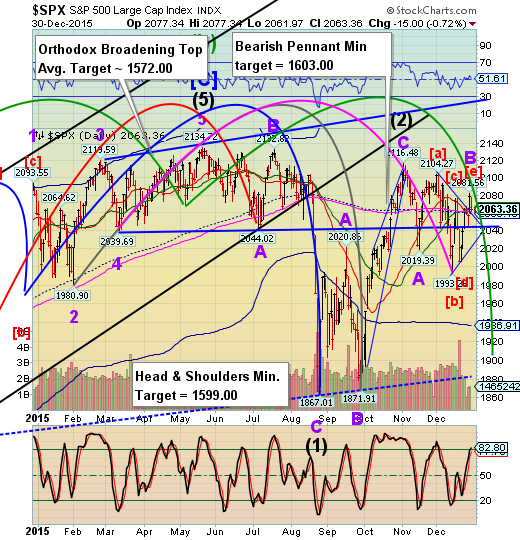
SPX appears to have completed its Triangle formation and declined beneath its 50-day Moving Average at 2066.69, putting it on an aggressive sell signal. Confirmation comes beneath its mid-Cycle support and 200-day moving Average, both at 2061.00. Last week I discussed that the last thrust of the Triangle formation would give a positive “lift” to the market for the Christmas holiday. Unfortunately, there seems to be no follow-through into the New Year.
(Bloomberg) For U.S. stocks, it’s been a wild ride to nowhere.
The Standard & Poor’s 500 Index has registered a move of at least 1 percent on a closing basis 11 times in the past 20 days, putting December on pace to be one of the bumpiest months for U.S. stock investors who have seen that type of back-and-forth only two other times since 2011.
Yet the stock market overall hasn’t changed much – the benchmark index is nearly flat in both December and the full year, even as one measure of volatility jumped throughout 2015. The difference between the highest point and the lowest point touched by the S&P 500 during daily trading sessions averaged 23 points this year, the most since 2008, according to data compiled by Bloomberg.
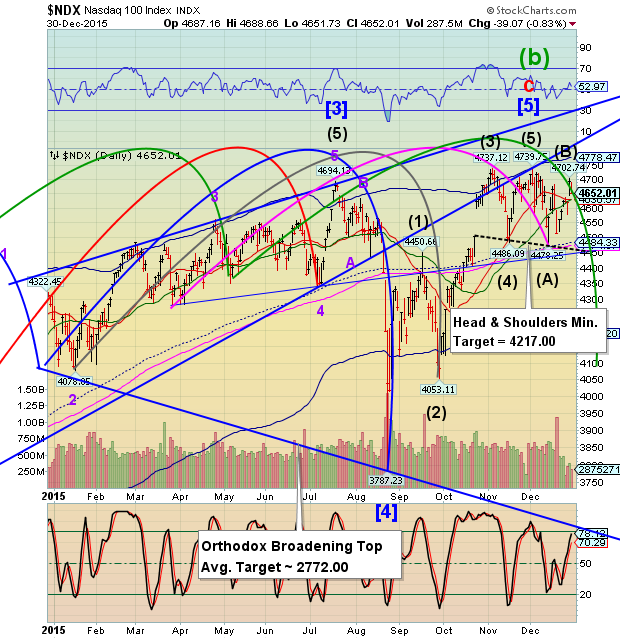
NDX appears to have completed a retracement of its December 14 decline. A decline beneath its 50-day Moving Average at 4630.59 puts NDX on an aggressive sell signal. Beneath that lies mid-Cycle support at 4484.33 and a potential Head & Shoulders neckline at 4450.00 that may confirm that signal.
(Reuters) Wall Street dropped on Wednesday as Brent crude slid towards 11-year lows and Apple (O:AAPL) weighed on the S&P 500 index, which clung to a meager gain for 2015.
Apple was the heaviest drag on the S&P 500 and Nasdaq Composite, falling 1.31 percent. Fears of potentially soft iPhone sales have helped push that stock down 9 percent in the past month.
Wednesday's losses undid much a broad rally in the previous session that was similarly influenced by tech and energy stocks.
Netflix (O:NFLX) and Amazon.com (O:AMZN), the S&P 500's top two performers in 2015, dipped 2.02 percent and 0.70 percent respectively.
Nike (N:NKE), this year's best-performing Dow component, fell 1.57 percent.
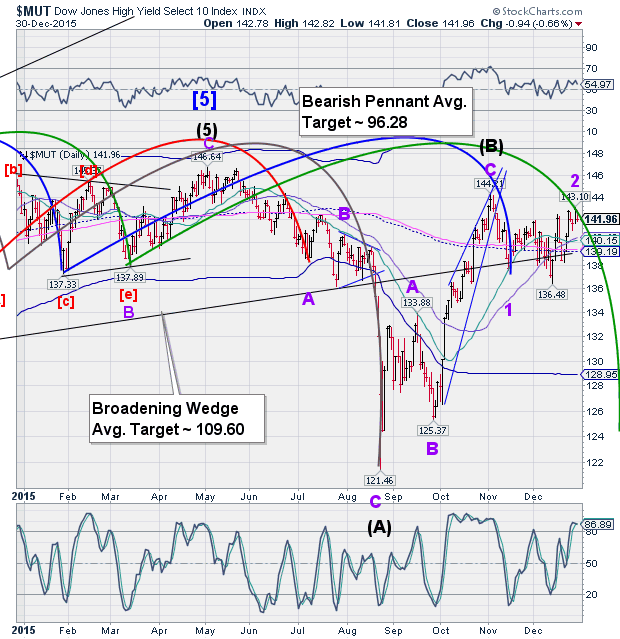
The High Yield Bond Index appears to have completed its rally today and made a reversal. This index does not appear to be as affected as many other high yield indexes and ETFs, due to the larger and higher rated companies in this index. However, this index will also turn down as quarterly earnings and corporate downgrades take their toll.
(Barrons) The junk bond debacle is taking a toll on more than just speculative-grade corporate debt. As MarketWatch writer John Coumarianos recently wrote, income investors are feeling the pain as even higher-quality income- producing securities are getting re-priced. And it is particularly painful for income mutual fund mandated to deliver yield anywhere they can find it, be it bonds, stocks or other sources.
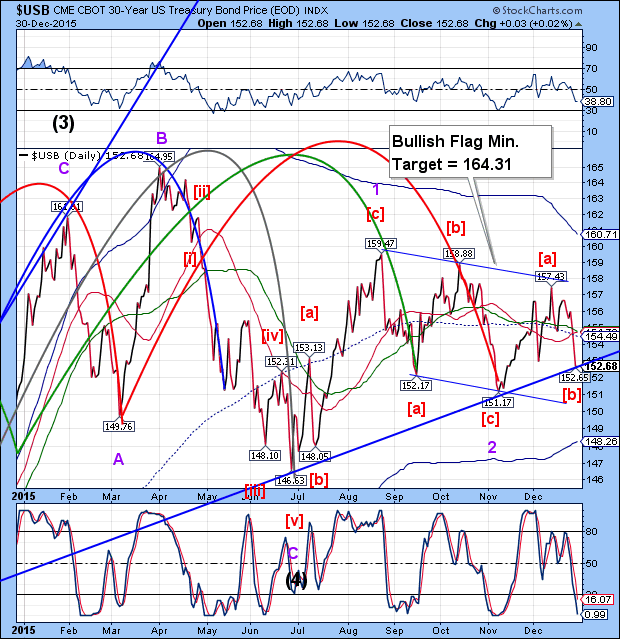
USB tested its Broadening Wedge trendline at 152.65 today in what may be a delayed Trading Cycle low. It is now due for a period of Cyclical strength that may last up to four weeks. The target for this phase of the rally appears to be Cycle Top resistance at 160.71.
(ZeroHedge) U.S. government bonds eked out some price gains Wednesday as lower oil prices cut investors’ appetites for riskier investments.
Some fund managers also scooped up Treasury debt as part of their month-end portfolio adjustments after a $29 billion sale of seven-year notes. The auction wrapped up new U.S. Treasury debt supply in 2015.
On the last trading session of each month, newly minted bonds replace maturing debt in many bond indexes. Fund managers who track the indexes typically replicate the changes by buying bonds, focusing on longer-term maturities.
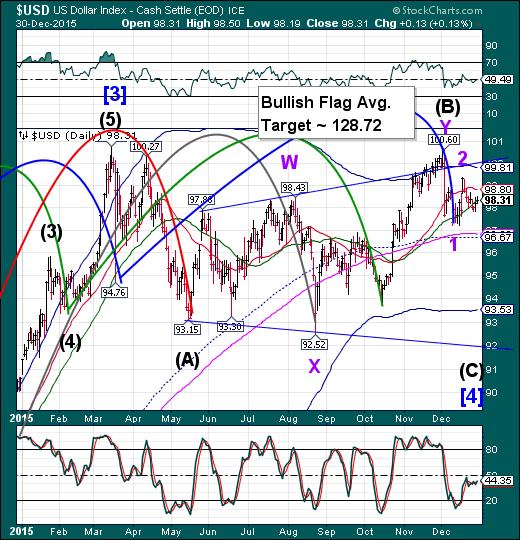
The U.S. dollar closed beneath its 50-day Moving Average at 98.35 as it wraps up a consolidation pattern leading into its next decline. The next target appears to be mid-Cycle support at 96.67. The Cycles Model suggests another month of decline should follow with deeper lows.
(DailyFX) The US Federal Reserve has finally raised interest rates and ended its long-standing Zero Interest Rate Policy (ZIRP); this in itself should leave the US dollar well-positioned versus major counterparts through the start of 2016. And indeed the Fed’s hike stands in sharp contrast to the European Central Bank, which moved to cut interest rates just a week before the FOMC decision. Market reactions to both the ECB and the Fed are nonetheless telling—the euro rallied sharply as the ECB’s rate cut was less aggressive than feared, while the US dollar was mostly unchanged following a lackluster Fed announcement. Expectations play a massive role in driving currency price moves, and we focus in on the Fed in particular to start the New Year.
.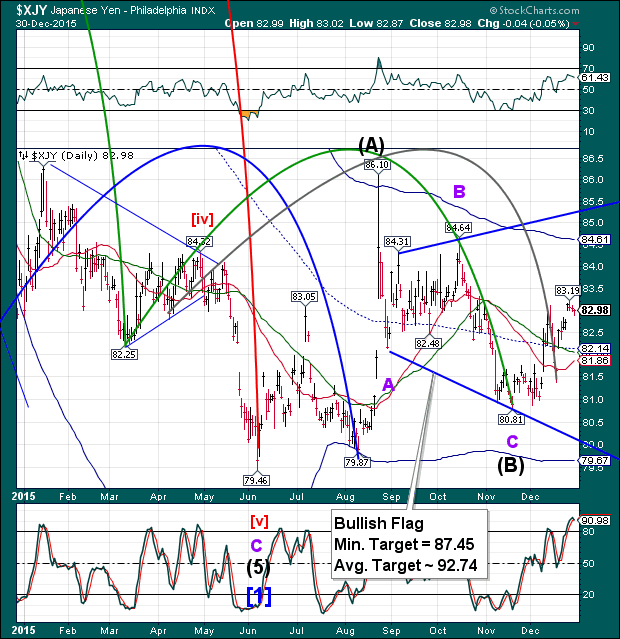
The yen appears to have made a master Cycle low on December 17. It has made a new Cycle high on its way to meet Cycle Top resistance at 84.61, possibly in the next move. The yen may have begun a rally that may take it as high as its upper trendline or higher, should it extend. It appears to be ending the year on a strong note and may see that strength continue into 2016.
(MarketRealist) The ultra-easing policy stance adopted by the BoJ (Bank of Japan) has always ensured that the yen’s outlook remains negative. It’s expected to be different in 2016 especially in terms of the Japanese yen’s forecasts. The BoJ made it clear that a strong yen isn’t something that it wants. The expectations of a strong yen are mainly due to the economy. It has been strengthening over the past 12 months. The BoJ undertook a recent monetary policy measure. Against the market’s expectation, the asset purchase program wasn’t increased.
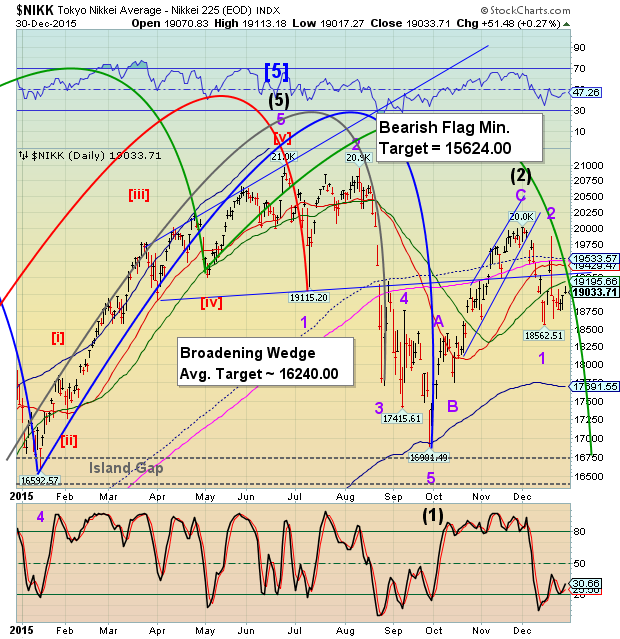
The Nikkei gave up all the gains made on the December 18 spike rally (due to options expiration) on the following Monday.The prior week I had warned, “While the Cycles Model anticipates several weeks of decline in the Nikkei, it won’t be without strong pullbacks.” The chart patterns suggest a very strong decline (flash crash?) into the middle of January.
(WallStreetObserver) Japanese stock market ended its year with a high note, ranking it amongst the world’s best-performing major indexes. In its last day of the year, the trade closed with an up of 0.3% to 19,033.71, bringing in a strong lead from Wall Street overnight.
The index’s performance over the year was triggered by the economic recovery in the US, a feebler yen, including the Bank of Japan’s asset purchases. Japanese markets remained closed on Thursday for a public holiday.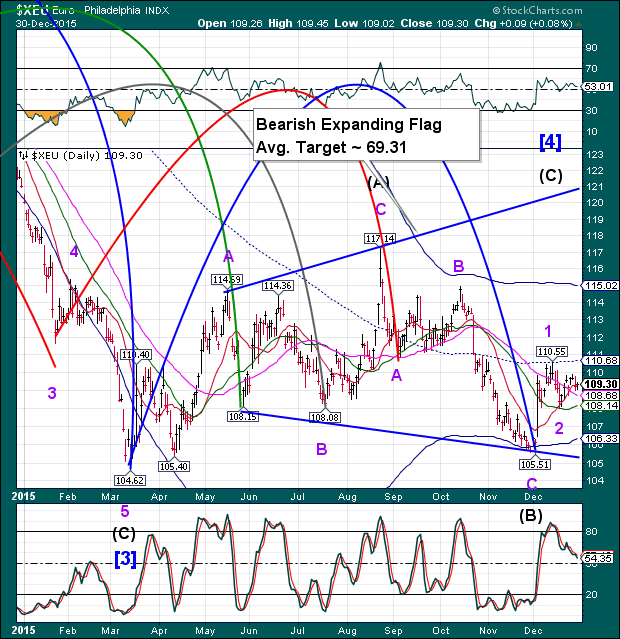
The euro closed above Short-term support at 109.29, while surpassing the other nearby support/resistance zones. The next period of strength may take the euro higher with a breakout above its prior high and its mid-Cycle resistance at 110.69. XEU may rally as high as the Broadening formation trendline at 120.00 through mid-January. From there the decline may resume in earnest. This may catch a lot of hedge funds and traders wrong-footed.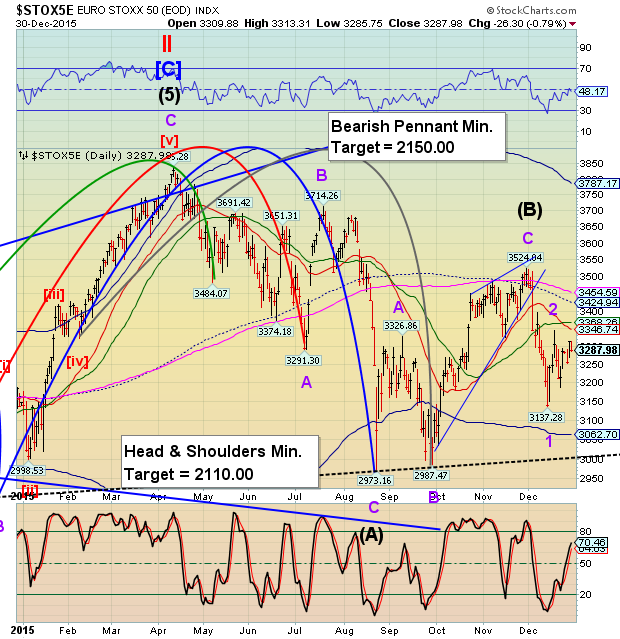
The EuroStoxx may have ended its retracement attempt beneath all critical supports. It could not achieve the 50-day Moving Average at 336826, nor could it reach Short-term resistance at 3346.74. Having lost all near-term support, EuroStoxx may challenge of the lower supports at the Cycle bottom or the Head &Shoulders neckline with a possible Master cycle low in late January. This may develop into a panic decline should the trendline be broken.
(Bloomberg) European stocks fell on the last full trading day of the year as a slide in oil prices weighed on investor sentiment.
The Stoxx Europe 600 Index lost 0.5 percent at the close of trading, after yesterday’s 1.4 percent gain. The volume of shares changing hands was 40 percent lower than the 30-day average. Markets will shut on Friday for New Year. Some including Germany, Switzerland and Italy, will also close tomorrow for New Year’s Eve, while others will have shorter trading hours.
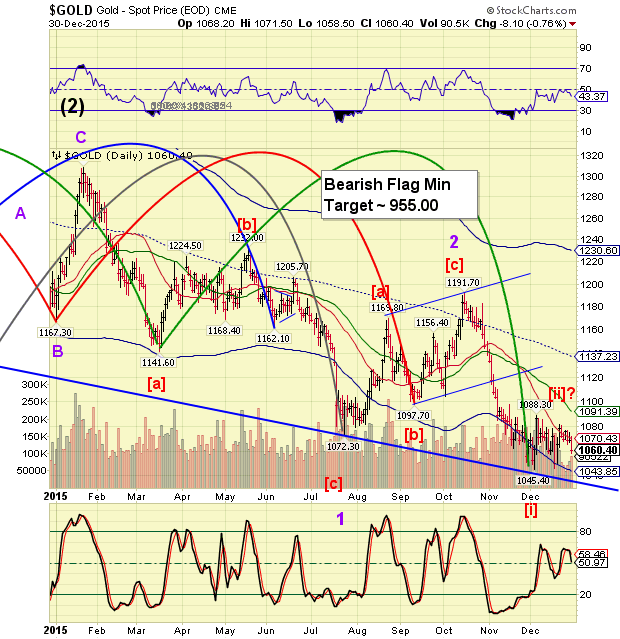
Gold appears to have completed an irregular correction on December 21. If so, the critical numbers to watch are the previous low at 1045.40 and the Cycle Bottom support, currently at 1043.85. Those who are bullish must be warned that this decline may last through mid-February, 2016.
(Bloomberg) Investors resumed sales from gold-backed funds as traders increased expectations that the Federal Reserve will raise interest rates again in March. Bullion futures posted a third straight decline.
Holdings in gold exchange-traded products fell 0.9 metric ton on Tuesday to erase gains made the previous day, data compiled by Bloomberg show. Assets have declined 10 times in the last 12 sessions to 1,466.3 tons, near the lowest in more than six years.
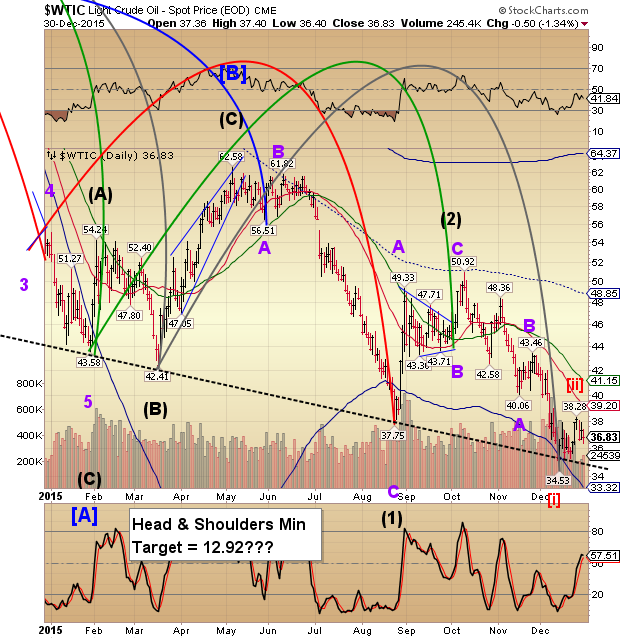
West Texas Intermediate Crude appears to have completed its correction at 38.28 on December 24 and reversed lower. The decline may continue through early February, when the next Master Cycle bottom is anticipated.
(Reuters) Crude prices fell more than 3 percent on Wednesday, with Brent sliding toward 11-year lows, after an unusual build in U.S. stockpiles and signs Saudi Arabia will keep adding to the global oil glut.
Crude inventories in the United States, the world's largest petroleum producer, rose 2.6 million barrels last week, the U.S. Energy Information Administration said. Analysts polled by Reuters had expected a draw of 2.5 million barrels.
Stockpiles hit record highs at the Cushing, Oklahoma delivery hub for U.S. crude's West Texas Intermediate (WTI) futures. Gasoline and heating oil also posted larger-than-expected stock builds.
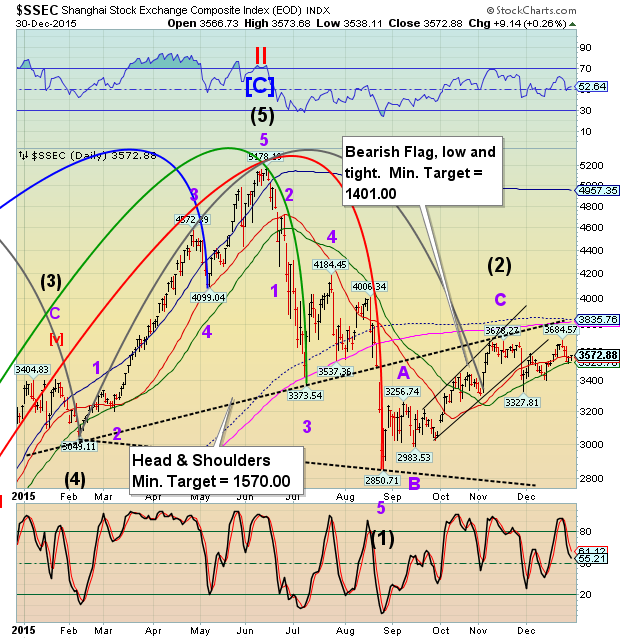
The Shanghai Index has bounced from its 50-day Moving Average on Tuesday and appears to be making a short retracement of its decline. Once the reversal is underway, a break of the 50-day Moving Average at 3525.76 may incite a panic decline that could exceed the August decline. We may see the decline resume in earnest as liquidity from the US dollar dries up.
(ZeroHedge) For the first time since the August collapse, Offshore yuan is trading over 1000 pips weaker (relative to the US dollar) than onshore yuan, signalling outflows are once again escalating. Following the chaos in HIBOR money-markets, Offshore yuan has crashed to 6.5970 (below August spike lows) to the weakest since Dec 2010. On the heels of this recent divergence between on- and off-shore yuan, China has suspended some foreign banks from FX trading, we suppose to try and stem the capital outflows.
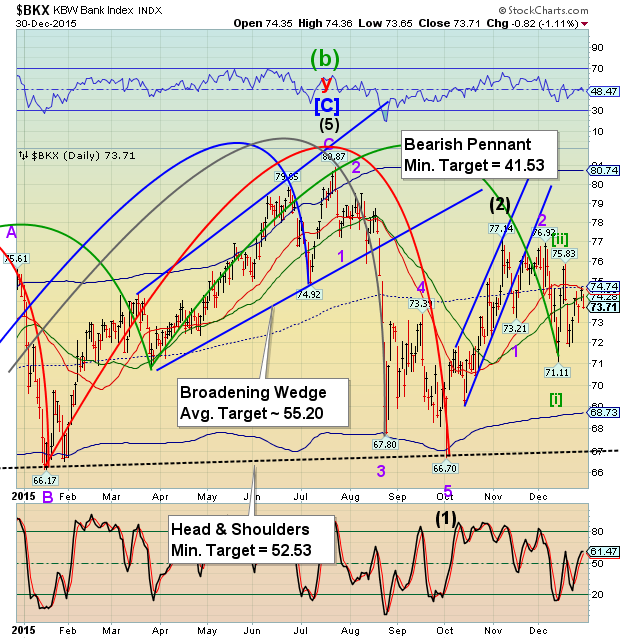
The Banking Index was repelled at mid-Cycle resistance at 74.74. BKX made it Pivot on Tuesday, just one day later than expected. There are about three weeks to the next Master cycle lowA loss of near-term supports may induce a challenge of the October 2 low.
(WashingtonExaminer) Federal Reserve Chairwoman Janet Yellen and the rest of the central bank will face new risks of populist criticism in 2016 and beyond, as it aims to raise interest rates by paying potentially hundreds of billions of dollars to banks for holding reserves at the Fed.
The Fed has paid banks to hold excess reserves at the central bank since 2008, but the payments have not attracted much political attention, partly because the rate it paid, 0.25 percent, was close to zero. In December, however, the central bank raised the rate to 0.50 percent as part of its effort to lift its interest rate target from zero. Current projections from the Fed's monetary policy committee members have the rate rising above 3 percent in the next three years.
In that scenario, the Fed could be paying banks close to $100 billion annually for keeping reserves at the Fed. That, in turn, would pose special political risks to the central bank and its independence, just one of many difficulties that Yellen and company must navigate in the years ahead in trying to return the country's monetary policy to normal.
(WSJ) Investors who keep an eye on their bank statements in the coming year are likely to get a preview of how the Federal Reserve’s higher interest-rate target will affect bank earnings.
Traditionally, banks benefited from rising interest rates because they held off on raising deposit rates while quickly lifting rates charged on many loans. In earlier periods of rate increases by the Fed, deposit rates moved up by about 0.25 percentage point while the prime rate rose much more. This boosted their net interest margins and flowed directly through to the bottom line.
Anyone counting on this to happen in this rate cycle, however, is probably in for a shock. New banking and money-market fund regulations have dramatically altered the demand for cash in ways that are likely to benefit the retail customers of banks—and weaken bank profits.
(ZeroHedge) One of the biggest quandaries of this cycle for the US economy has been the amount and growth of commercial bank loans. Virtually non-existent for the first three years of the centrally-planned new normal, something changed in 2012 at which point US bank loans, led by Commercial and Industrial or C&I lending growing at a double-digit pop, started to rise at an impressive pace, asking many to wonder: maybe the biggest driver for a sustainable economic recovery is in fact present,because where there is loan demand, there is velocity of money.
A few years later, as the loan growth persisted with virtually no flow through to GDP growth, we - and others - wondered: we know there is a "source of funds", but what about the "use of funds" - how can banks be creating tens of billions in loans if virtually nothing was ending up in the broader economy?
