Get 40% Off
🚨 Volatile Markets? Find Hidden Gems for Serious OutperformanceFind Stocks Now

Microsoft Stock Traders Await Earnings Results

Published 10/26/2020, 08:22 AM
Updated 07/09/2023, 06:31 AM

Microsoft (NYSE: NASDAQ:MSFT) traded higher on Friday, after hitting support near 212.00 on Thursday. Overall, the stock is trading above a short-term tentative upside support line drawn from the low of Sept. 18, and thus, we would consider the near-term outlook to be positive at the moment.

However, given that, tomorrow, the company announces its earnings results, we prefer to hold a cautious stance ahead of the release.
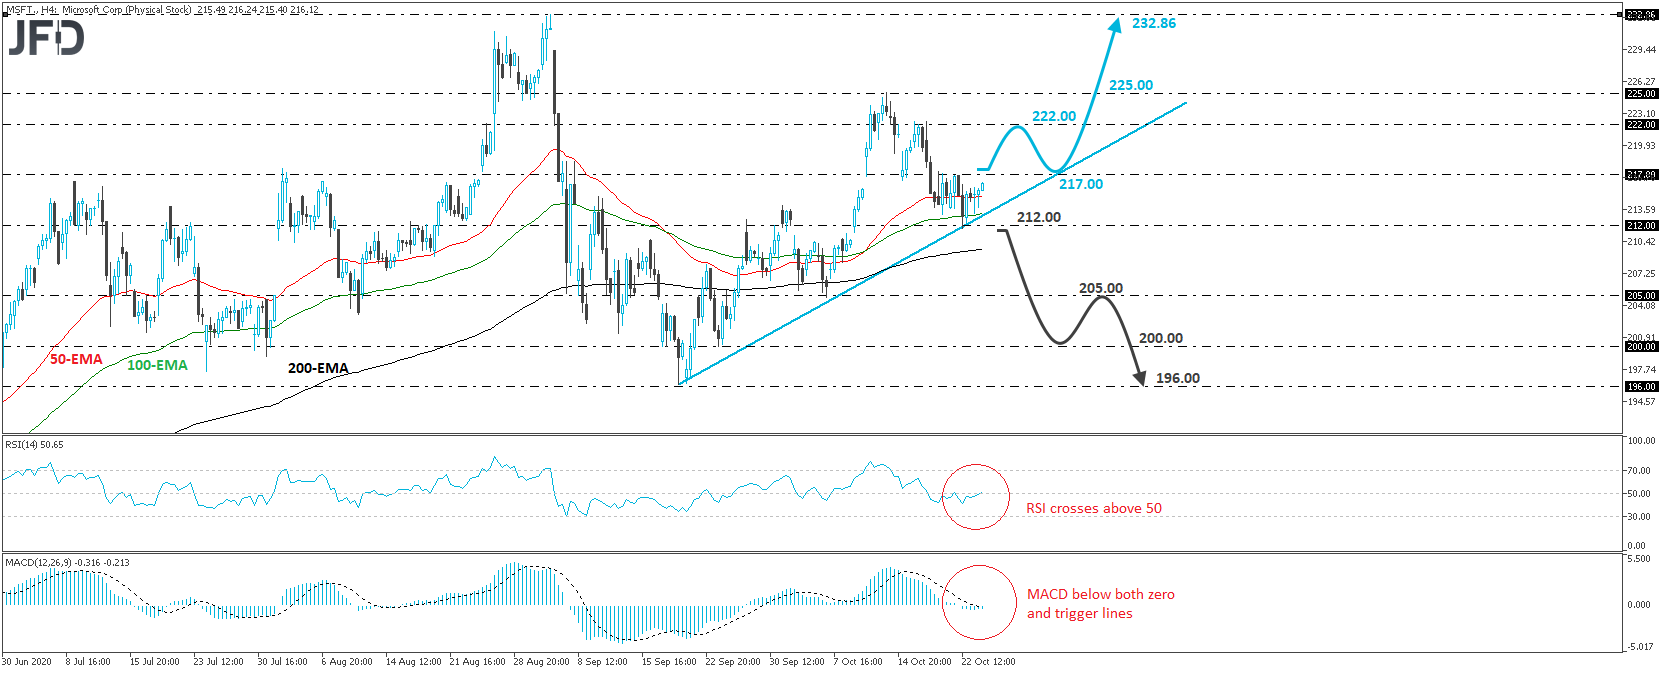
If the results come out better than expected, the stock may rise above the 217.00 barrier, a move that may be a trend-continuation signal. Investors may then decide to push the price towards the 222.00 level, or even the 225.00 barrier, marked by the peak of Oct. 13.

Another break, above 225.00, would confirm a forthcoming higher high and may carry larger bullish implications, perhaps paving the way towards the stock’s all-time high, at 232.86, hit on Sept. 2.

Looking at our short-term oscillators on the 4-hour chart, we see that the RSI has just poked its nose above the 50 level, while the MACD, although slightly below both its zero and trigger lines, shows signs of bottoming. Both indicators suggest that the stock may start gathering upside speed again soon, which corroborates the case for some further near-term advances.

Now, in case earnings surprise to the downside, the share price may slide below 212.00, thereby confirming a forthcoming lower low. It will also be below the aforementioned upside line, and thus, investors may allow declines towards the 205.00 zone, near the low of Oct. 6. If that zone is not able to halt the slide, the next support may be the psychological round figure of 200.00, which prevented the stock from falling lower on Sept. 23 and 24. In case that level is also broken, we may see the slide extending towards the low of Sept. 18, at around 196.00.
Microsoft stock 4-hour chart technical analysis

3rd party Ad. Not an offer or recommendation by Investing.com. See disclosure here or remove ads .

Latest comments

Risk Disclosure: Trading in financial instruments and/or cryptocurrencies involves high risks including the risk of losing some, or all, of your investment amount, and may not be suitable for all investors. Prices of cryptocurrencies are extremely volatile and may be affected by external factors such as financial, regulatory or political events. Trading on margin increases the financial risks.
Before deciding to trade in financial instrument or cryptocurrencies you should be fully informed of the risks and costs associated with trading the financial markets, carefully consider your investment objectives, level of experience, and risk appetite, and seek professional advice where needed.
Fusion Media would like to remind you that the data contained in this website is not necessarily real-time nor accurate. The data and prices on the website are not necessarily provided by any market or exchange, but may be provided by market makers, and so prices may not be accurate and may differ from the actual price at any given market, meaning prices are indicative and not appropriate for trading purposes. Fusion Media and any provider of the data contained in this website will not accept liability for any loss or damage as a result of your trading, or your reliance on the information contained within this website.
It is prohibited to use, store, reproduce, display, modify, transmit or distribute the data contained in this website without the explicit prior written permission of Fusion Media and/or the data provider. All intellectual property rights are reserved by the providers and/or the exchange providing the data contained in this website.
Fusion Media may be compensated by the advertisers that appear on the website, based on your interaction with the advertisements or advertisers.
© 2007-2024 - Fusion Media Limited. All Rights Reserved.