
Microsoft:
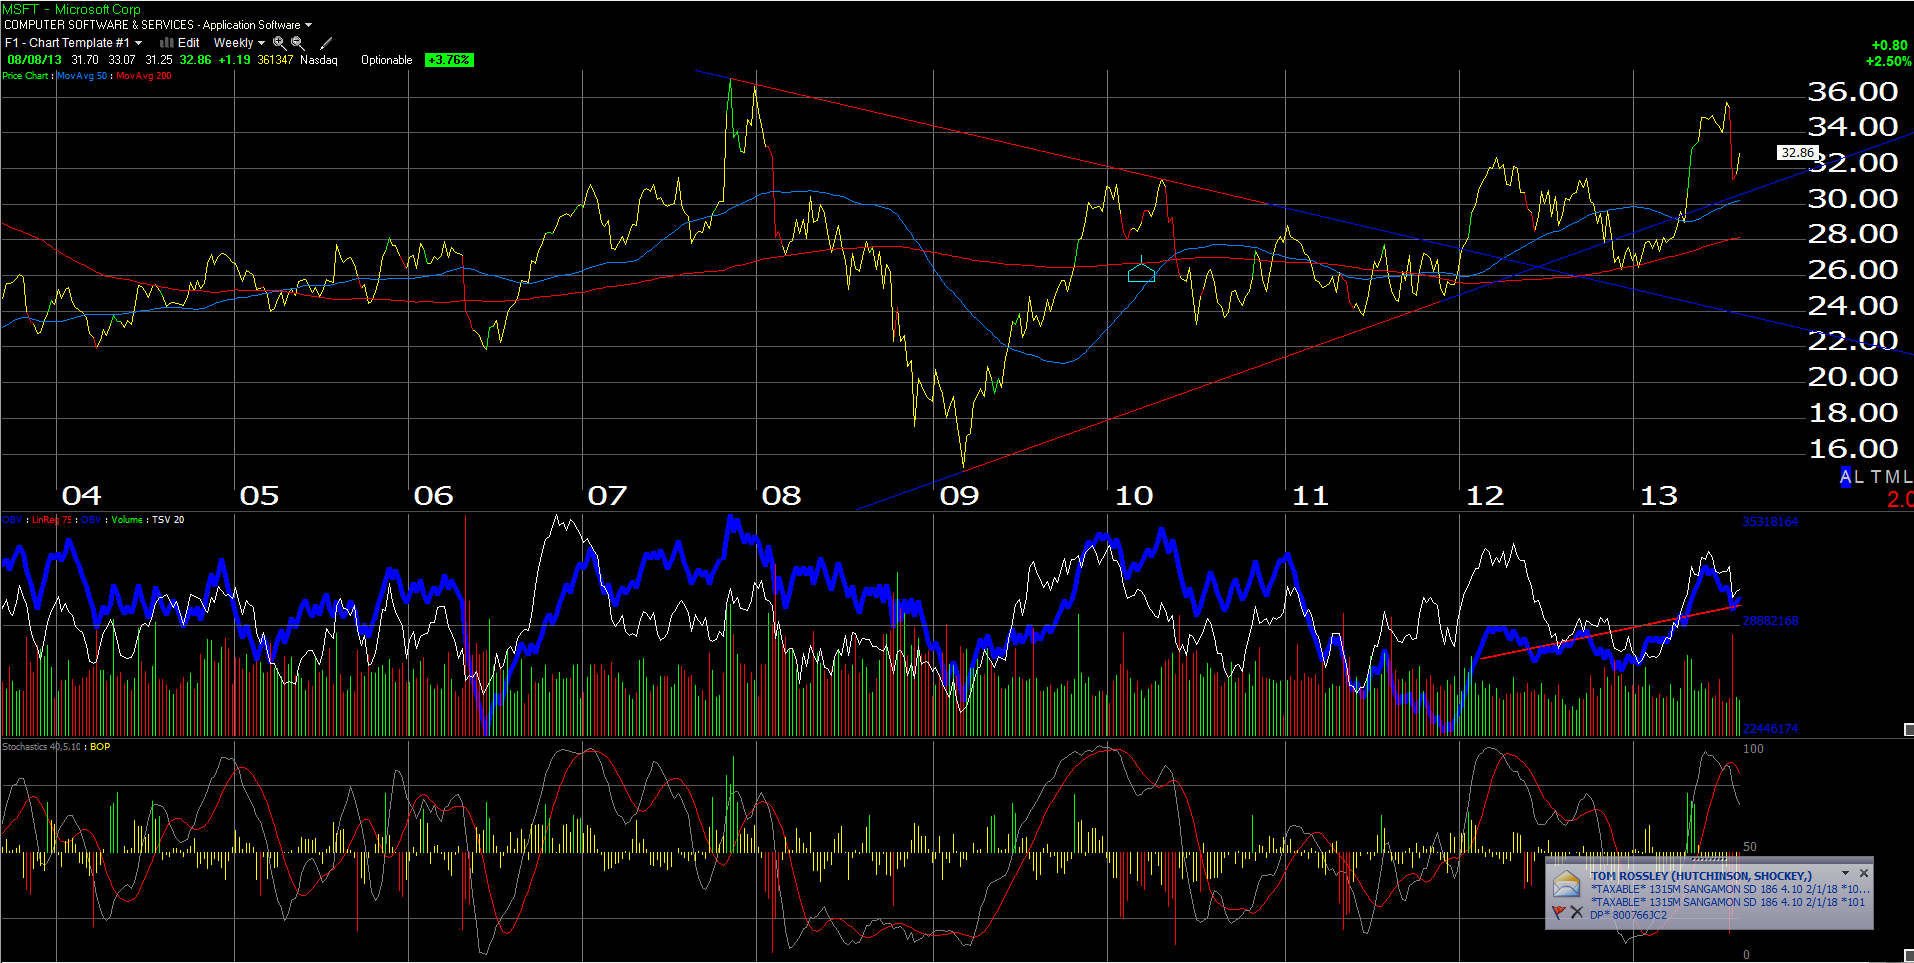
The first chart is Microsoft (MSFT), which fell from $36 to $31 per share following the disastrous fiscal 4th quarter for Softee, thanks to a $900 ml write-down of Surface tablets, which cost the software giant $0.07 per share of the $0.09 miss. However as bad as the quarter was for the Surface product line, the fact is just about every product line came in a little weak, thanks to continued PC cannibalization and weakness in MSFT’s major dominant product line.
That being said – for an investor in MSFT – not all is lost. With $77 billion in cash on the balance sheet (which is $9 per share, leaving MSFT trading at 3(x) balance sheet cash), and the current share repurchase plan due to expire on September 30th, we could shortly hear from MSFT about a higher dividend, a bigger share buyback plan, and more importantly, what I hope will be an ASR or accelerated share repurchase plan that is badly needed.
The most important cash-flow metric for MSFT that you aren’t hearing about from Wall Street is that MSFT is returning just 50% of its free-cash-flow to shareholders currently. My only question to Ballmer and some of the other village idiots that are on the Board of MSFT is “What the bleep are you waiting for ?” Does MSFT plan an acquiring IBM (IBM) or maybe Apple (AAPL)? Even if they bought Twitter at Twitter’s planned expected IPO valuation of $10 bl, it would still be just a small percentage of MSFT’s cash.
Here is MSFT’s free-cash-flow for the last 5 quarters AND the combined dividend and share repo dollars spent:
Q4 ’13: $4.1 bl and $2.9 bl
Q3 ’13: $8.7 bl and $2.9 bl
Q2 ’13: $3.8 bl and $3.4 bl
Q1 ’13: $6.6 bl and $3.4 bl
Q4 ’12: $7.0 bl and $2.7 bl
That is a total of $30 billion in free-cash-flow generated in JUST the last 5 quarters, and only $15 bl was returned.
With 1.1 billion common shares outstanding, an ASR for 1/4 of outstanding shares would represent just $9.5 billion dollars, or 12% of the current cash balance, or about 2 quarters of free-cash-flow.
This is ridiculous – MSFT could cut their shares outstanding in half, and replace the cash in under 5 years, given their current cash flow.
This capital needs to be returned to shareholders. It is getting late in the game… Steve Ballmer should retire as well.
Freeport :
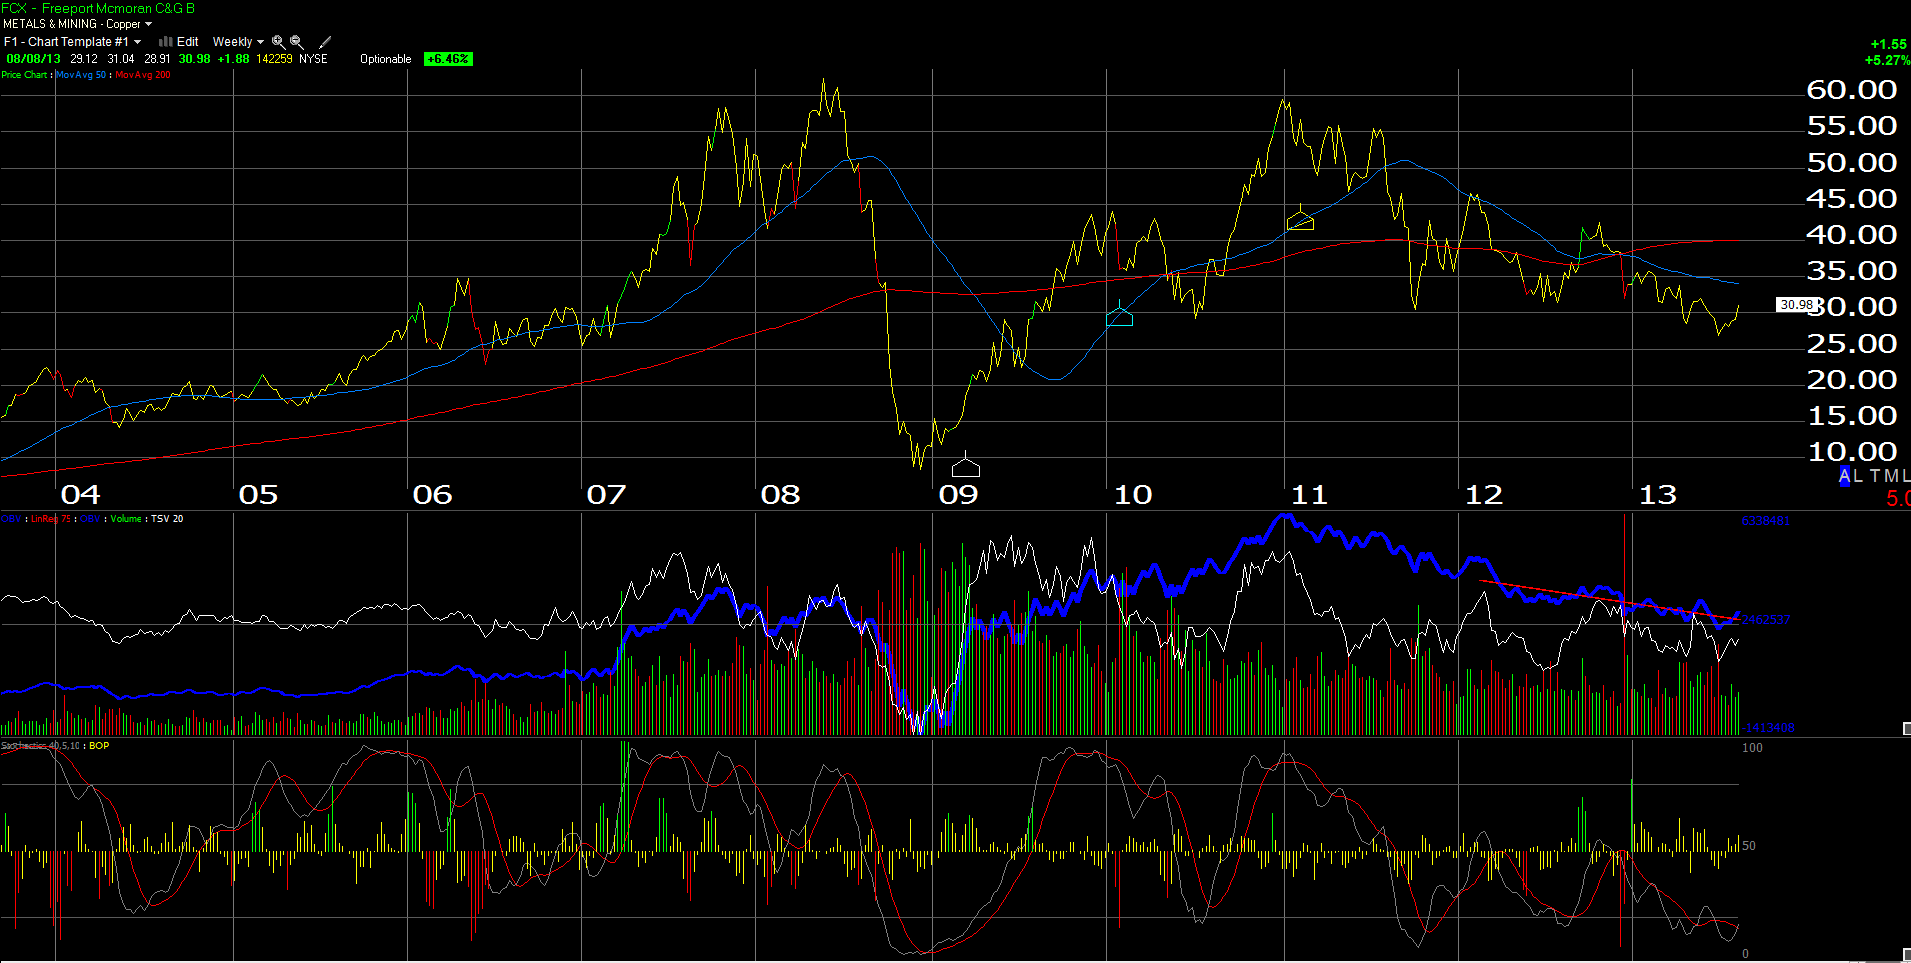
Freeport (FCX) got a lift Friday morning from the Chinese trade data, as well as a rumour (read on Briefing.com) that Carl Icahn might be interested in the stock. (Only if Bill Ackman is thinking about shorting it – I’m kidding.)
Here is Gary Morrow’s technical commentary on FCX from this morning:
“Freeport Mcmoran is showing very bullish signs this week. The stock is up over 7% from Monday’s lower close, the bulk coming from today’s 5% breakout move. FCX opened today with an upside gap before easily taking out the July peak. Volume powering the move is accelerating and by the close will be the stock’s heaviest upside day since bottoming in late June. This is very encouraging action and may signal the end of a very disappointing year long run for the copper miner.
It is now looking very likely that FCX put in a significant bottom this summer. After an April/May bounce the stock sunk to fresh 52 week lows. In late June shares fell below the May lows but reached a higher oversold reading in the process. This divergent action often times precedes a significant low. In July FCX put in a higher low as downside pressure eased. This month, with another probable higher low, upside trade is returning.
In the near term FCX has a solid layer of support in place between $29.00 and $30.00. This area includes the July high as well as last week’s peak. If the stock is in the early stages of a healthy bull leg this support zone should hold. A close below the current August low of $28.90 would erase the breakout action and set the stage for a prolonged base. At this point I believe an important bottom has been reached and FCX is on a solid recovery path. Initial upside target is the 200 day moving average near $34.00. FCX has not tested this key level since the massive December 2012 collapse.”
Gary gives the key stop-loss level at $28.90.
Copper is up sharply today on the China news, which is always a tell for FCX, although the McMoran Oil and Gas merger lessens FCX’s correlation to and dependence on copper pricing, at least less so than the last 10 years.
The forward 4-quarter estimate for FCX is $3.11 leaving the stock trading at a little under 10(x) forward earnings for an expected decline in EPS in 2013 of 23%, but expected growth in 2014 of 27%.
Basic Materials, particularly the metals and mining group, have gotten rocked the first 6 months of this year. Fundamentally, the Basic Mat sector has seen a 3300% decline in earnings growth from 10/1/12 through 6/30/13. (Not a typo.) I’m looking for the sector to get a bid as China and Europe improve, since Europe is an important end market for China. However it not yet in the sector earnings estimates. 3rd quarter trends will be key.
A return to global growth should help all the cyclical sectors including Basic Materials.