In the first part of our research, we highlighted our broad market super-cycle trend analysis. This analysis suggests the global markets are shifting away from a stock market appreciation phase into a depreciation phase. This shift will likely prompt a new commodities sector appreciation phase to begin fairly quickly.
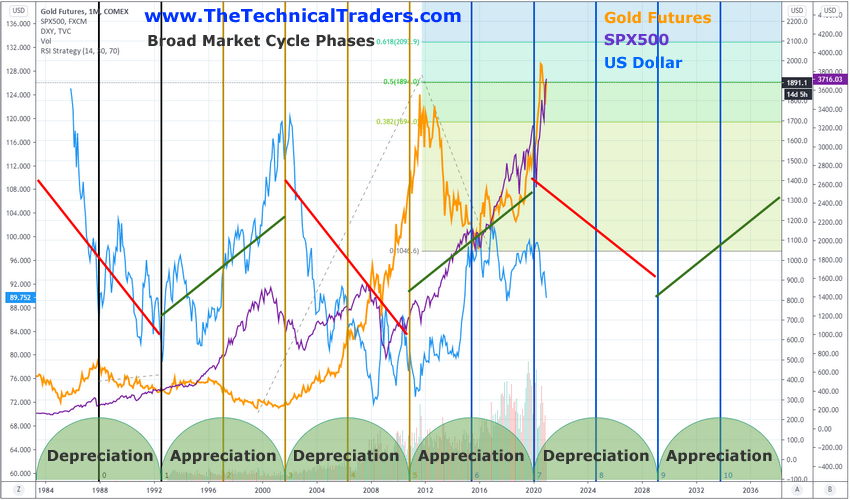
If you remember how gold started to move higher in 2003~04 after reaching low price levels in 2001? My research team and I believe a nine to 9.5 year appreciation/depreciation cycle takes place in stocks and commodities, and the relationship between the two is inverted. For example, the bottom in gold, which took place in 2001, also aligned with the end of a U.S. stock market appreciation cycle that started in 1992. The rally in gold after 2001 was directly inverted to the new depreciation cycle in the U.S. stock market at that time.
Let's review these past long-term Appreciation/Depreciation cycles:

If our research is correct, the current depreciation phase has just started, and we are experiencing an “excess phase” (blow-off) top formation in the U.S. and global stock markets. This longer-term cycle phase chart (below) helps to illustrate how these cycles work. Even though some of you may be able to find areas on this chart where the U.S. stock market did not decline within a depreciation phase, watch how the U.S. dollar and gold reacted throughout these phases as well. It is critical to understand that each of these assets can, and often do, engage in counter-trend phases (at times) when shifts in phase dynamics are more evident. For example, the peak in the U.S. stock market in 2000 was an example of how the U.S. stock market reacted to a pending phase shift before gold and the U.S. dollar began to react efficiently to this phase shift.

Notice how we've also drawn the current and next phase of the markets highlighting target ranges out to 2036 and beyond.
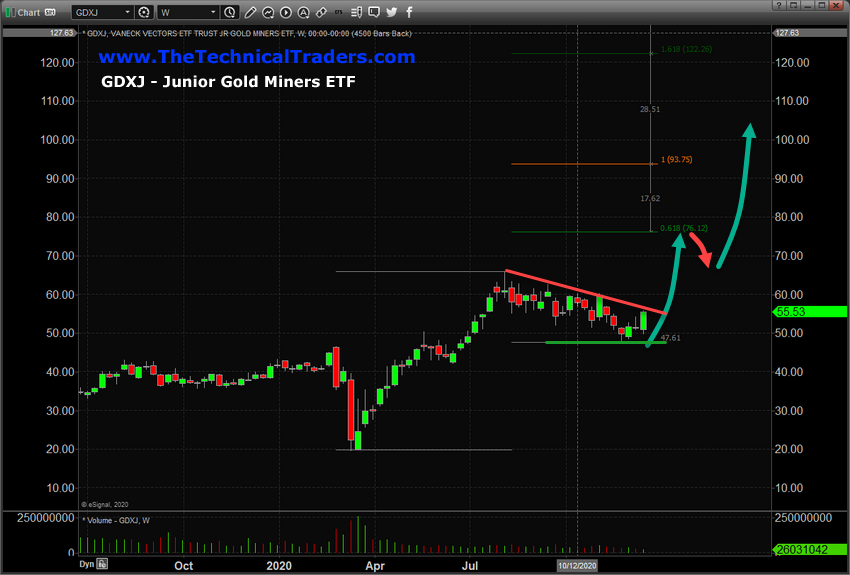
Junior Gold Miners Should Rally In Legs – Targeting $95 or higher
Our research team believes the end of the current stock market excess phase will happen some time in early-to-mid 2021. The end of this phase will usher in a new phase of capital deployment where investors seek out undervalued assets and hedge risk in the global markets. Just like what happened after the bottom of the global markets after the 2009-10 credit market crash, it took nearly 2+ years for the markets (including precious metals) to come to the realization that a new stock market appreciation phase had setup. This took place from 2012 to 2013. After that shift in thinking took place, investors moved capital into the U.S. stock market and away from hedge assets, which resulted in a very strong upward price trend reaching the peak levels we see today.
Our researchers believe the appreciation phase ended in 2019 and we are currently experiencing the same type of “excess phase” (blow-off top) that took place in precious metals in 2012~2013. The end phase rotation of assets chasing a potentially weakening trend in the global stock market. When and if this excess phase ends, commodities and precious metals should really begin to skyrocket higher.
Junior miners, seen in this (NYSE:GDXJ) chart below, should begin to move higher in advancing legs. We've drawn these legs on the chart (below) as arrows – showing you how price may advance in the future. Each advancing leg will “reset” after a brief pause/pullback, then another advancing leg will begin. Remember, this is a longer-term appreciation phase in commodities and metals that should last through 2026~2027 (or longer).

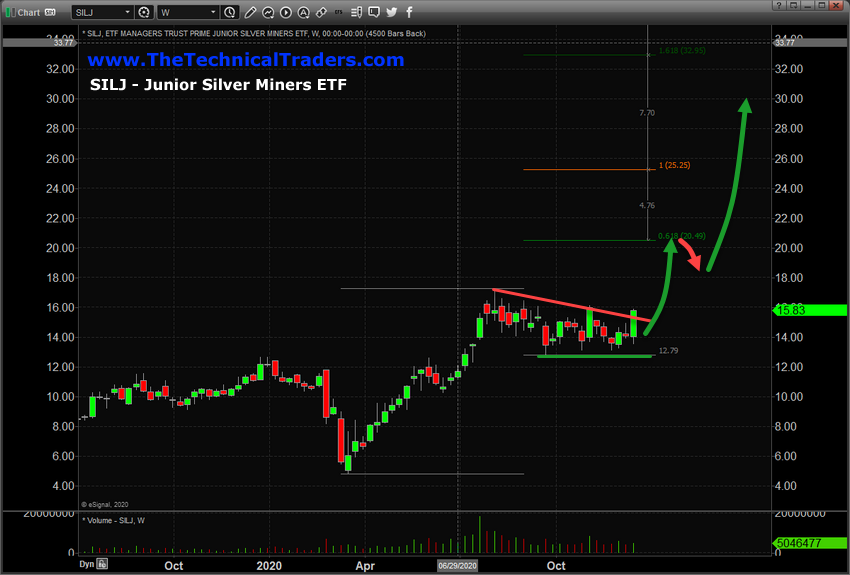
Junior Silver Miners Should Also Rally In Legs
Junior Silver Miners, (NYSE:SILJ), should begin to advance to levels near $21, then stall for a few days/weeks, then attempt to advance to levels above $28~$30 if our research is correct. This advance in the Junior Silver miners will not likely peak near $30 though. This rally in metals, miners, and other commodities may last well beyond 2026~27 based on our research. This type of trend could really turn into a life-changing appreciation/depreciation phase for traders.

