
What a week for metals and the markets. The Transportation Index is up nearly 4% for the week. The Dow Jones Industrial Average is up more than 3% for the week. Silver is up over 14% and
reached a peak near $30 (over 23%). Gold is up over 2.5% and trading above $2,025 right now – with a peak price level near $2,090. If you were not paying attention this week, there were some really big moves taking place.
Melt-Up With High Risks – Pay Attention
Overall, our research team believes the current “melt-up” price action is likely to continue as global investors continue to believe the U.S. Fed will do everything possible to save the collapsing world economy. We are nearing a critical juncture in price, as you can see from this YM Weekly chart below. A series of lower highs has set up since the peak in February 2020 which suggests some new price weakness may lie just ahead. But until we see a substantial downside price move triggering a new bearish trend (a closing price below $26,000), then we must assume the melt-up will likely continue.
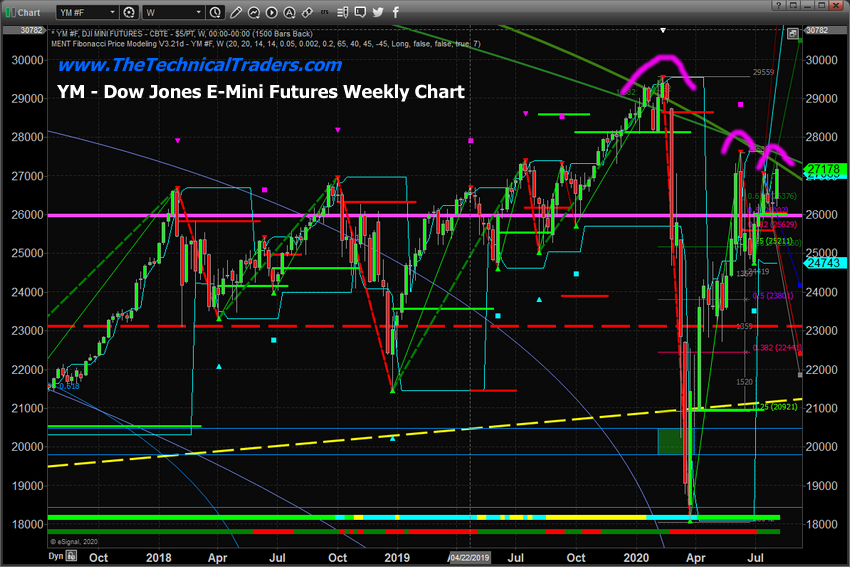
The current price rotational range on the YM, from a peak near $27,600 to a trough near $24,765, presents a moderately large and volatile price range for traders totalling 2,835 points.
Skilled traders should not discount the risks and volatility which are still very present in the current market environment. Don't misinterpret this melt-up as a lower volatility bullish price trend. This market can chew your head off in less than 60 seconds if you are not careful and properly position your trades.
The real risks going forward relate more to a technical failure of price near the current peak levels (near $27,300). If a downside price trend were to initiate soon, this could confirm a “lower high” Fibonacci technical pattern, which would suggest a failure to attempt to breach the previous high pivot level near $27,600. n short, this is a “wait and see” type of situation where volatility is likely to spike as the markets attempt to either continue the “melt-up” or fail and begin a new downside price trend.
Weekly Transportation Index Rising
This Weekly Transportation Index chart further highlights the lower-high patterns that have continued to set up over the past 24+ months. The first peak level on this chart occurred on Sept. 10, 2018. Our research team believes the real peak in the global markets occurred in early January 2018. All of our modelling systems suggest that the early January 2018 peak was the peak in organic economic growth and a capitulation top. Since then, the subsequent peaks appear to be valuation (capital shift) level peaks that are not supported by organic economic activity. Think of these as “false price peaks” related to how capital is shifting around the globe chasing returns.
In order for the global markets to attain an organic growth phase, credit, debt and consumers must all participate in the expansion of economic activity. Since early 2018, when the U.S. Fed shocked the markets and the U.S.-China trade issues initiated, a number of economic factors have weakened over time – particularly the global consumer activity and credit markets. We believe the recent efforts by the U.S. Fed and global central banks have attempted to buoy these aspects of the markets as global credit and trade concerns mount.
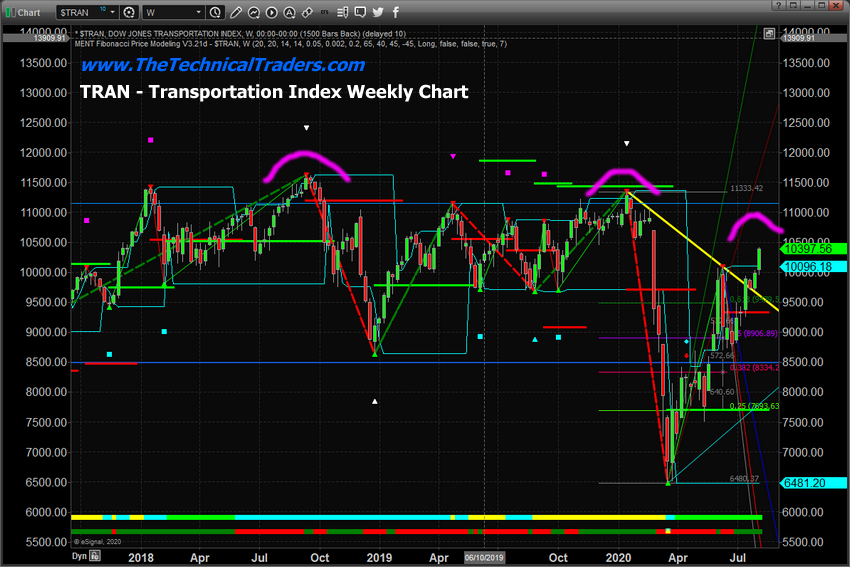
The Transportation Index, one of our favorite charting symbols, clearly shows the failed “higher-high” peaks over the past 24+ months. The current peak level, near 10,400, is -8.35% below the January/February 2020 peak levels. It seems highly likely that the “melt-up” process may push the TRAN price high enough to fill the gap that was created in February, near $10,800 if it continues to push price levels higher. Yet, we believe the risk levels which have recently been screaming at us because of the huge upside moves in gold and silver are extreme right now. In other words, gold and silver are kicking us in the forehead and screaming, “Hey, we are skyrocketing because the global market risks are excessive and traders are not paying attention to these risks right now.” So our advice for skilled technical traders would be to stay cautious and expect a continued melt-up until it ends.
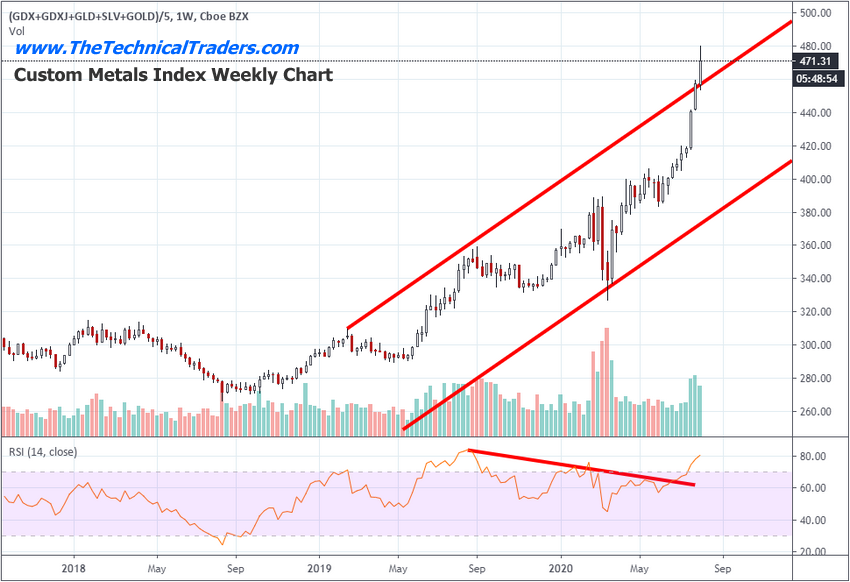
Custom Metals Index Screams High Risks
This Weekly Custom Metals Index chart clearly highlights the big breakout trend that has taken place over the past 6+ weeks and really accelerated higher over the past 3+ weeks. Almost every trader on the planet knows that metals hedge risk. When metals start to move higher, one should expect the global markets to become excessively volatile and risky – which suggests skilled technical traders must learn to properly position-size and address new risk factors.
Our research team believes the move in metals has just started. We published an article early this week that highlighted many of our earlier research posts to help you understand the true nature of the risks in the markets and how metals will act to hedge these risks.
As metals continue to climb higher, skilled traders should interpret this upside price move as “the markets are entering higher risk and volatility levels” – even if these larger concerns are materially evident in the current price trend. Metals move higher when global traders expect much higher risk factors and excessive unknowns. In other words, metals are the canary in the coal mine as they tell you to be prepared for potentially very large price rotations and serious unknown events in the near future.
As we close out this week and head into the late summer months, our advice would be to prepare for increased volatility, the strong potential for unknown events to take place and a moderate “melt-up” to continue until it breaks lower. If gold clears $2,300 over the next 3+ weeks, then we suggest moving into a very protective mode for your portfolio and assets. A move like this would suggest global traders expect some type of major event to take place and risks are not subsiding.
As we suggested throughout 2018 and all of 2019, 2020 and the next 3+ years are going to be excellent opportunities for skilled technical traders to profit from big price swings. Recently, we just closed two active trades for a quick 11% profit in the markets.