Our Most Attractive and Most Dangerous stocks for May were made available to the public at midnight on Monday. April saw some strong performances from our picks. Our Most Attractive Stocks portfolio rose by 1.2%, outperforming the S&P 500 (-0.4%). Small Cap Alliance Fiber Optics Products (NASDAQ:AFOP) led the way with an 18% gain. On the Large/Mid Cap side, Aspen Insurance Holdings (NYSE:AHL) rose 17% on news of a buyout offer, which the board wisely declined. AHL still has room to rise and remains on our Most Attractive list this month.
Our Most Dangerous stocks also outperformed as a short portfolio last month as they fell by 1.8% or 1.4% more than the S&P 500. Small Cap Quidel Corporation (NASDAQ:QDEL) fell by 22% while Large/Mid Cap Alexander & Baldwin Inc. (NYSE:ALEX) fell by 10%.
This success underscores the benefit of sticking to our value-investing strategy. Being a true value investor is an increasingly difficult, if not impossible, task. By scrupulously analyzing every word in annual reports, our research protects investors’ portfolios and allows our clients to execute value investing with more confidence and integrity.
16 new stocks make our Most Attractive list and 13 new stocks fall onto the Most Dangerous list this month.
Our Most Attractive stocks have high and rising return on invested capital (ROIC) and low price to economic book value ratios. Most Dangerous stocks have misleading earnings and long growth appreciation periods implied in their market valuations.
Most Attractive Stock Feature For May: Valmont Industries (VMI: ~$150/share)
Valmont Industries (NYSE:VMI) is one of the additions to our Most Attractive stocks for May.
VMI has a great track record of growth and profitability. Over the past decade it has grown after-tax profit (NOPAT) by 26% compounded annually. VMI’s ROIC of 17% puts it well above the average of 10% for the 62 industrial machinery companies we cover.
VMI’s revenues and earnings were down in the first quarter of 2014 due to pricing softness and a lower level of backlog going into the quarter as compared to 2013. However, this weak quarter should not be seen as indicative of the company’s future performance. One bad quarter does not erase a decade of growth.
VMI’s produces important infrastructure products such as mechanized irrigation equipment, infrastructure for roadway lighting and traffic signals, and utility poles for electrical power transmission. These products should see a growth in demand from the developing world.
Power lines and irrigation are not sexy products, but we’ve seen in the past month or two what can happen to high-growth stocks in exciting industries like cloud computing and social media. VMI produces essential products, and it is one of the largest and most profitable companies in the sector. I expect the stable profit growth of the past decade to continue, though not at the same rapid rate it has been.
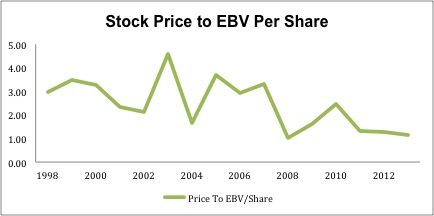
The market seems to have a less optimistic view of VMI, however, as it has priced the company for almost no growth. At ~$150/share, VMI has a price to economic book value ratio (PEBV) of just 1.2, which implies that the company will never grow NOPAT by more than 20% from current levels. Figure 1 shows that this is the cheapest VMI has been since 2008.
Figure 1: Historically Cheap Valuation

Sources: New Constructs, LLC and company filings.
Even with a highly conservative scenario of just 5.5% NOPAT growth compounded annually for 15 years, our DCF model gives VMI a fair value of $170/share. VMI is certainly capable of even higher growth, considering the 26% CAGR in NOPAT over the past decade, which gives the stock more potential upside.
Most Dangerous Stock Feature For May: Costamare Inc. (CMRE: $21/share)
Costamare Inc. (NYSE:CMRE) is one of the additions to the Most Dangerous list this month.
Like VMI, CMRE produces a key element of the global economic infrastructure: containerships. However, whereas VMI has high profit growth and a strong ROIC, CMRE’s ROIC is steadily declining. Since 2010, CMRE’s ROIC has fallen from 10% to 7%.
Even worse, the company is bleeding cash. Over the past three years it has lost $420 million in free cash flow. This outflow of cash has ballooned its total debt up to $1.9 billion (116% of market cap) from $1.3 billion in 2010. CMRE had to do a secondary stock offering in 2012 to raise cash, and with its poor cash flow and significant debt further stock dilution is a definite possibility.
Another major risk for CMRE comes from the fact that just five charterers make up 93% of its revenue. Its largest single customer accounts for 31% of its revenue. One lost customer, or even just a decline in activity from that customer, could significantly impact CMRE’s revenue streams.
One would expect a company with massive debt, negative cash flows, and declining returns on capital to be priced cheaply, but this is not the case for CMRE. In order to justify its valuation of ~$21/share, CMRE would need to grow NOPAT by 11% compounded annually for 17 years. These high expectations price out any potential upside the stock might have had while leaving significant risk.
Both VMI and CMRE might be classified as “safe” stocks that investors would turn to when the market is volatile as it has been recently. However, it’s important to distinguish a stock that is really safe from one that just looks safe. CMRE has a reasonable P/E and operates in a stable industry, but a closer look turns up the red flags we highlighted above.
Sam McBride contributed to this report.
Disclosure: David Trainer and Sam McBride receive no compensation to write about any specific stock, sector, or theme.
