Get 40% Off
🚨 Volatile Markets? Find Hidden Gems for Serious OutperformanceFind Stocks Now

Matic Network Price Analysis: Will Volatility Return To MATIC/BTC?

Published 09/13/2019, 05:29 AM
Updated 07/14/2021, 10:35 AM

On August 5, 2019, the Matic Network price reached a low of 80 satoshis. A rapid upward move followed, culminating with a high of 177 satoshis on August 7. After a period of decreases, MATIC reached similar highs on August 23. It has been on a downtrend since.
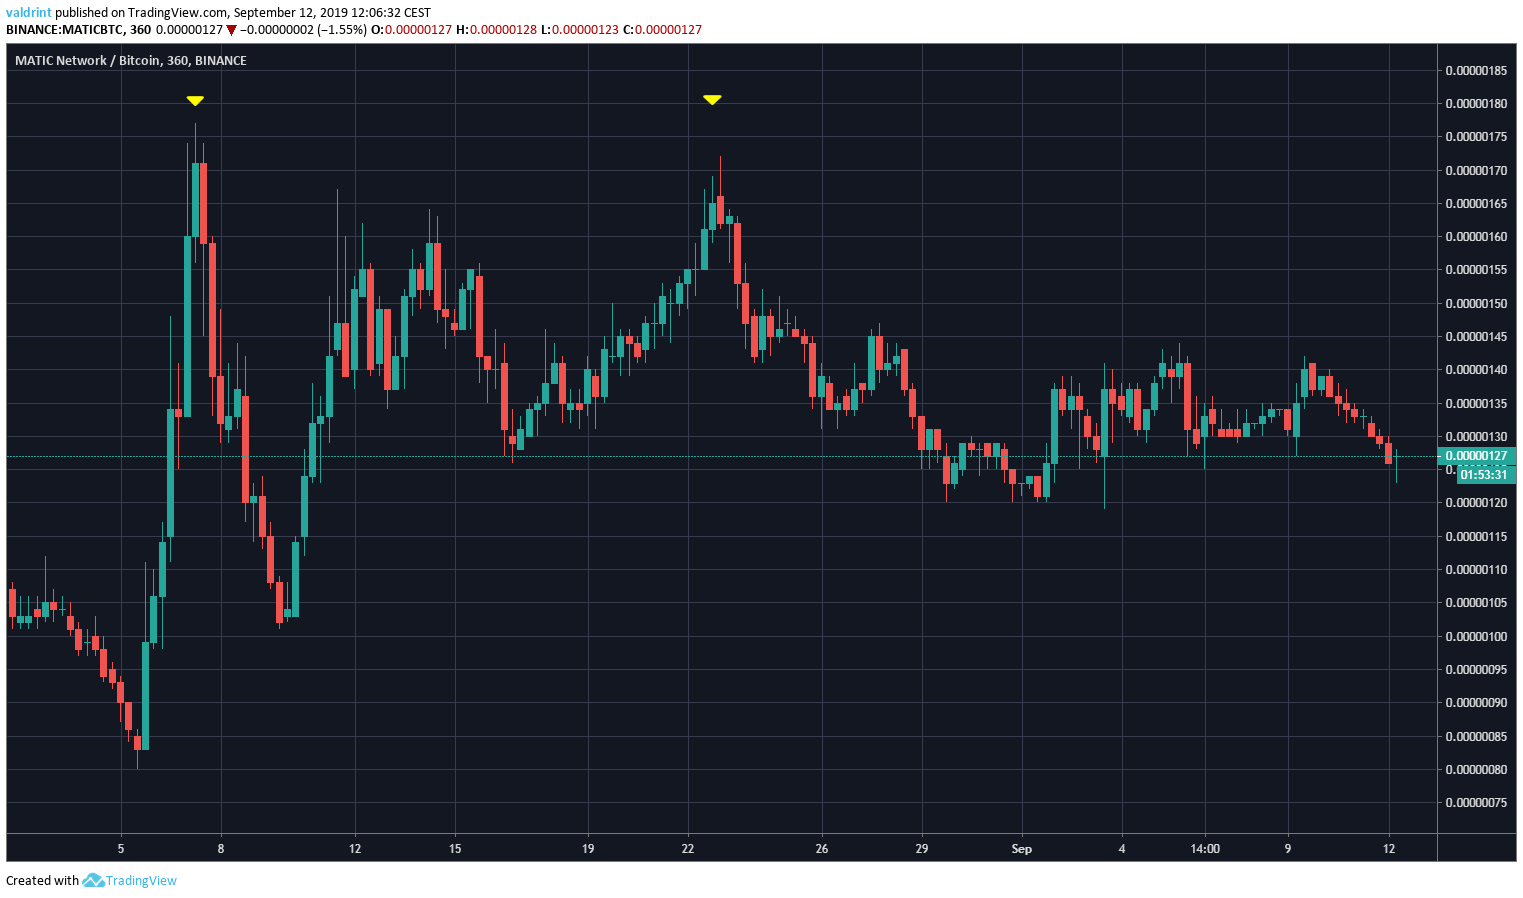
MAMatic Network/Bitcoin 360 ChartTIC Price

Will MATIC reach highs near 180 satoshis again?
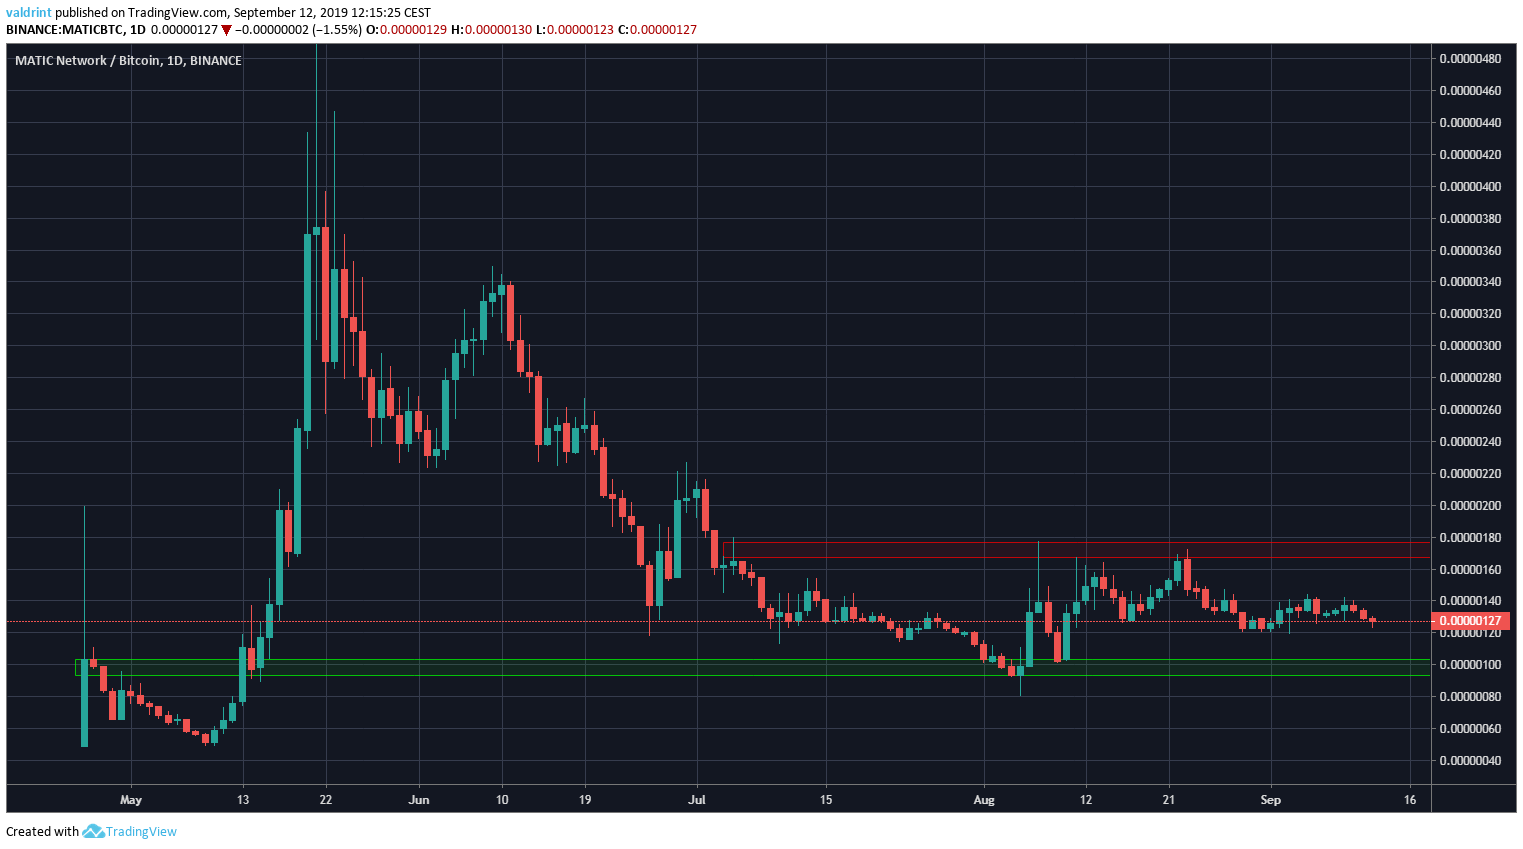
Matic Network/Bitcoin Daily Chart
Matic Network/Bitcoin 120 Chart

MATIC Price: Trends and Highlights for September 12

  • MATIC/BTC is not following any clear trading patterns.
  • There is support at 100 and 120 satoshis.
  • There is resistance at 170 and 140 satoshis.
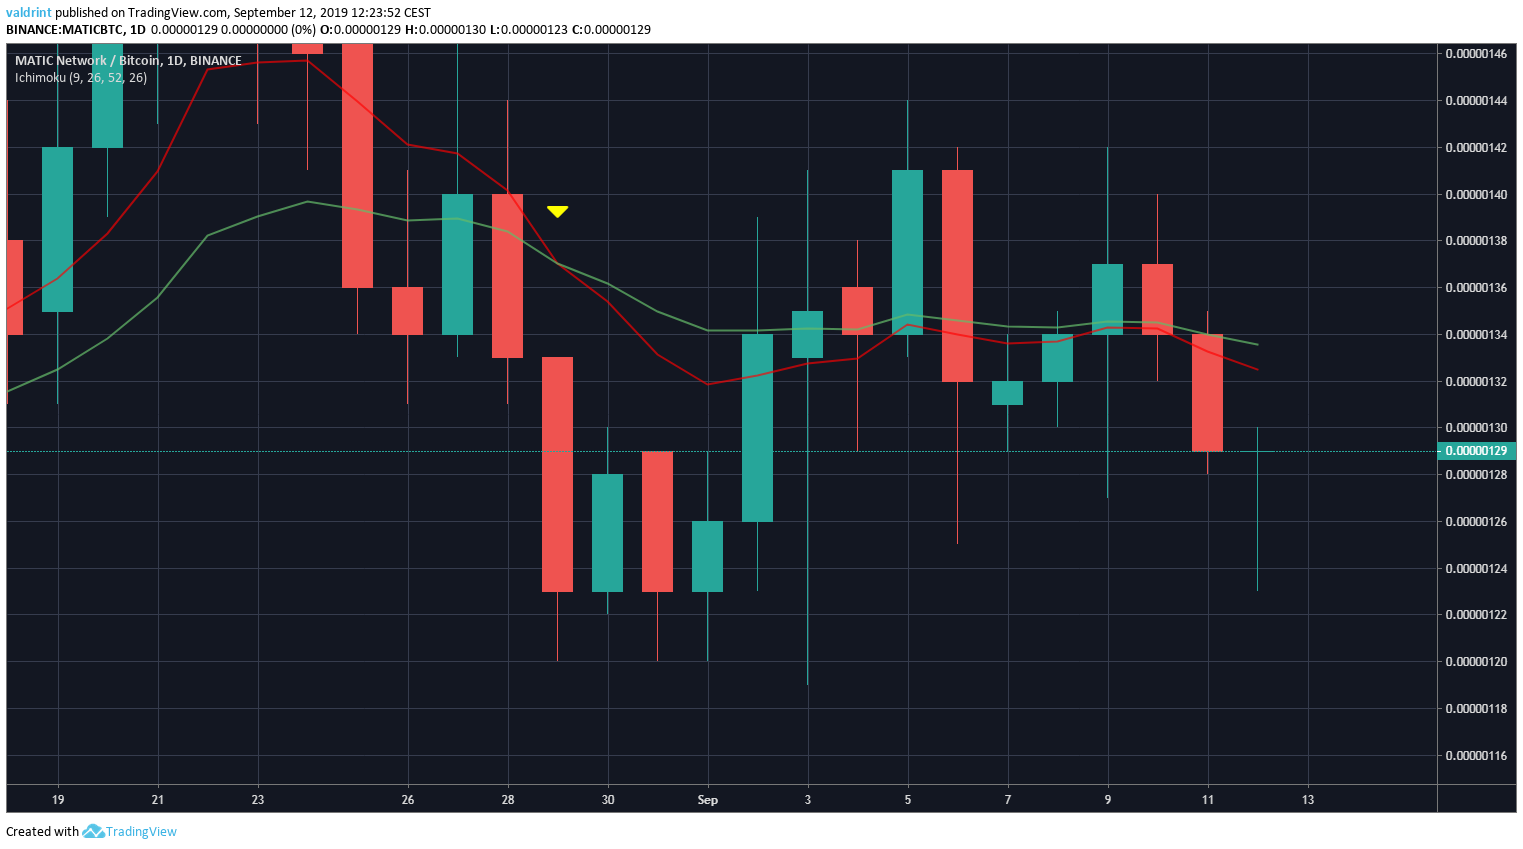
  • Daily moving averages have made a bearish cross.
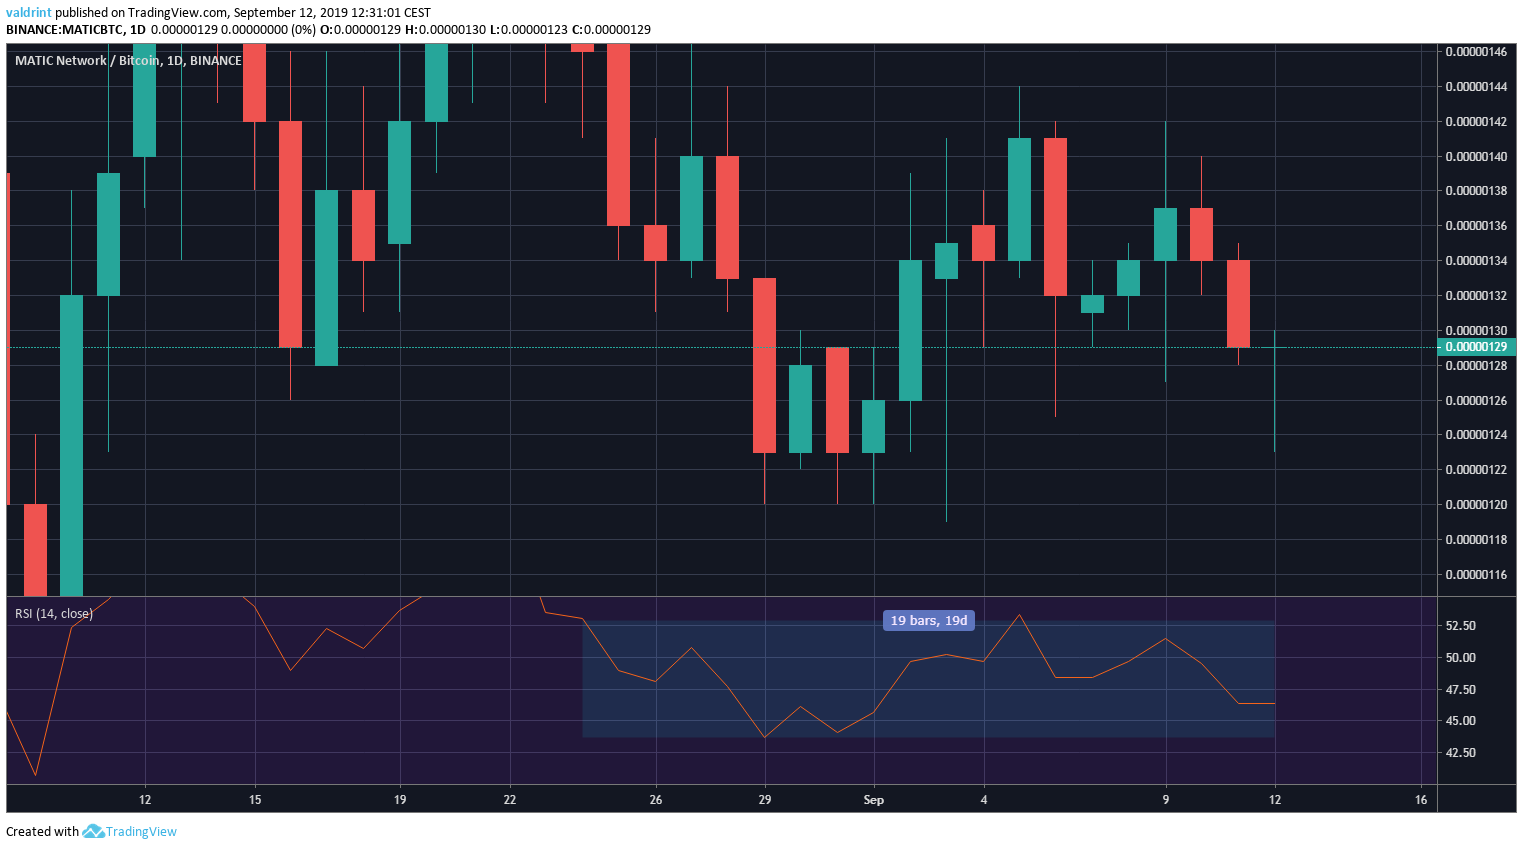
  • The RSI is in neutral territory.

Reversal Levels

Looking at the daily chart, we can see two very important reversal levels — one support and one resistance.The support area is found at 100 satoshis while the resistance one near 177 satoshis.Unless a breakout or breakdown occurs, we would expect the MATIC price to trade between these two levels.Let’s take a look at some technical indicators and determine how likely that is.

Technical Indicators

A look at the daily moving averages (MA) shows that there has been virtually no change in momentum in either side for the past two weeks.However, we can see that a bearish cross transpired on August 29.Additionally, the MATIC price is trading below the 10- and 20-day MAs.This is a bearish sign, which loses some significance by the fact that both MAs have an almost neutral slope.A similar outlook is given by the RSI.It has been trading between 43 and 53 for almost three weeks, indicating neither oversold nor overbought conditions. So, while the moving averages slightly lean on a bearish outlook, the RSI is neutral.

3rd party Ad. Not an offer or recommendation by Investing.com. See disclosure here or remove ads .

Short-Term Movement

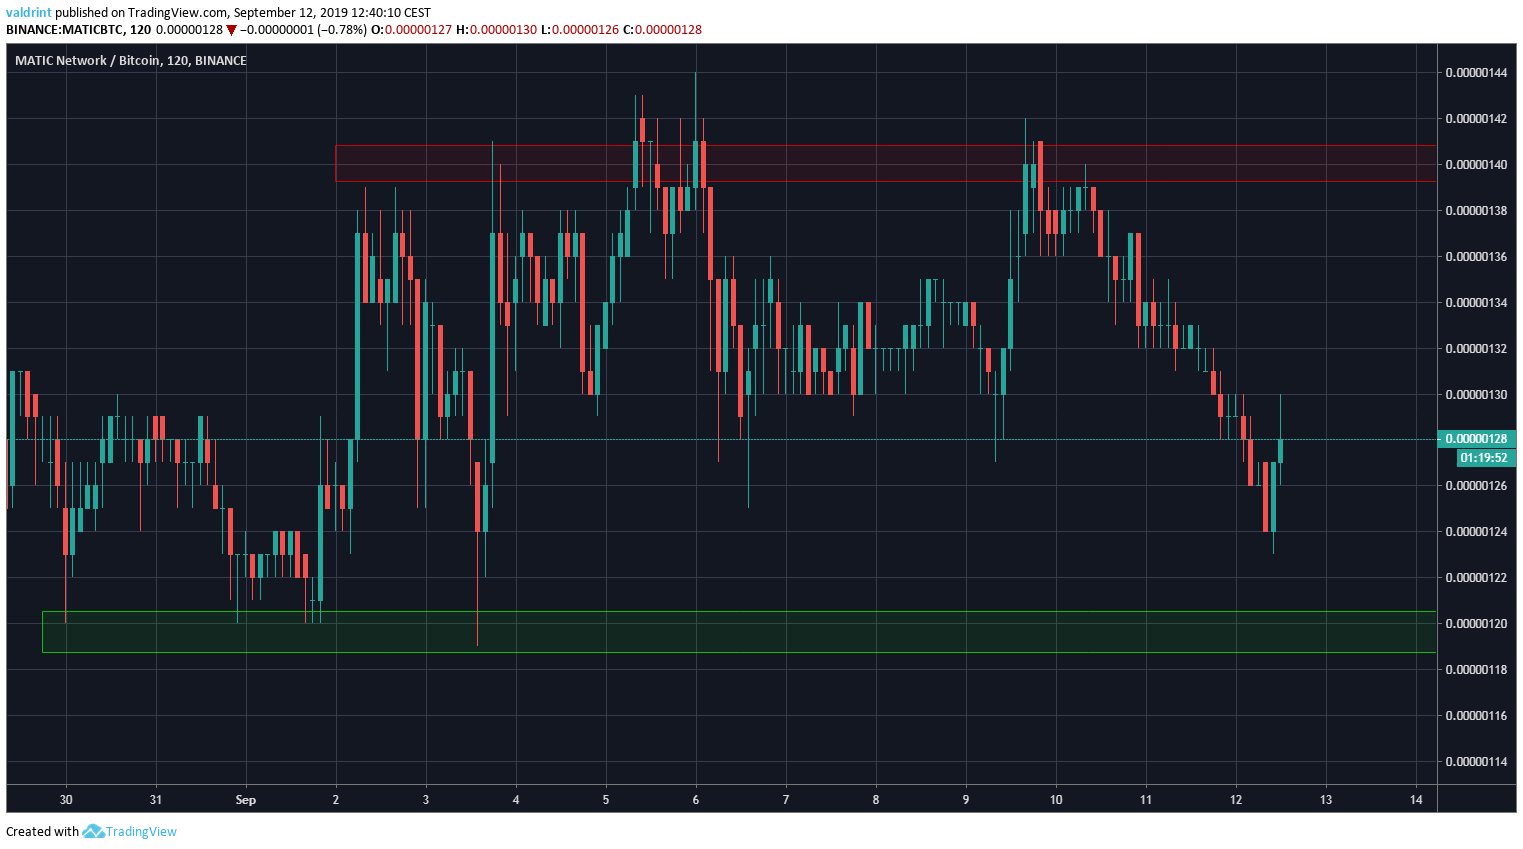
Looking at the two-hour chart, we can see one short-term resistance and one support area.The resistance is found at 140 while the support at 120 satoshis.We believe the MATIC price may drop to the support area. Afterward, it is likely to trade between these two areas without experiencing significant fluctuation.

MATIC Price Summary

The MATIC price reached a high on August 23 and has been decreasing since.

According to our analysis, it is likely to consolidate without much fluctuation.

For hypothetical trading purposes, we have a neutral outlook on MATIC

Latest comments

Risk Disclosure: Trading in financial instruments and/or cryptocurrencies involves high risks including the risk of losing some, or all, of your investment amount, and may not be suitable for all investors. Prices of cryptocurrencies are extremely volatile and may be affected by external factors such as financial, regulatory or political events. Trading on margin increases the financial risks.
Before deciding to trade in financial instrument or cryptocurrencies you should be fully informed of the risks and costs associated with trading the financial markets, carefully consider your investment objectives, level of experience, and risk appetite, and seek professional advice where needed.
Fusion Media would like to remind you that the data contained in this website is not necessarily real-time nor accurate. The data and prices on the website are not necessarily provided by any market or exchange, but may be provided by market makers, and so prices may not be accurate and may differ from the actual price at any given market, meaning prices are indicative and not appropriate for trading purposes. Fusion Media and any provider of the data contained in this website will not accept liability for any loss or damage as a result of your trading, or your reliance on the information contained within this website.
It is prohibited to use, store, reproduce, display, modify, transmit or distribute the data contained in this website without the explicit prior written permission of Fusion Media and/or the data provider. All intellectual property rights are reserved by the providers and/or the exchange providing the data contained in this website.
Fusion Media may be compensated by the advertisers that appear on the website, based on your interaction with the advertisements or advertisers.
© 2007-2024 - Fusion Media Limited. All Rights Reserved.