
Seasonality is a critical factor in the natural gas futures market. The price tends to reach highs as the winter months approach, and lows in the early spring after the peak season of demand.
The most recent high in the NYMEX natural gas market came in November 2019, when the energy commodity reached a high of $2.905 per MMBtu. In November 2018, the low level of stockpiles going into the peak season for heating demand took the price to nearly a four-year high at $4.929.
The lows typically come in February and March, at the end of the withdrawal season as stocks begin to build for the next peak season. By the summer months, natural gas prices are already looking forward to the coming winter. Meanwhile, 2020 has been anything but a typical year in any market. Natural gas fell to a new 25-year low in June at $1.432 per MMBtu. In July, the price remained under pressure and was at its lowest level of this century. The United States Natural Gas Fund (NYSE:UNG) tracks the price of the energy commodity futures higher and lower. The BOIL (NYSE:BOIL) and KOLD (NYSE:KOLD) products provide double leverage on the up and downside in the natural gas market.
Price Action Was Bearish in July
At the end of last week, the now active month September natural gas futures contract had bounced from a higher low at $1.646 on 20. In late June, September futures hit bottom at $1.583. Meanwhile, the continuous contract reached $1.432. The premium for the September contract is a function of both seasonality and the high level of stockpiles, which were at 3.241 trillion cubic feet as of July 24.
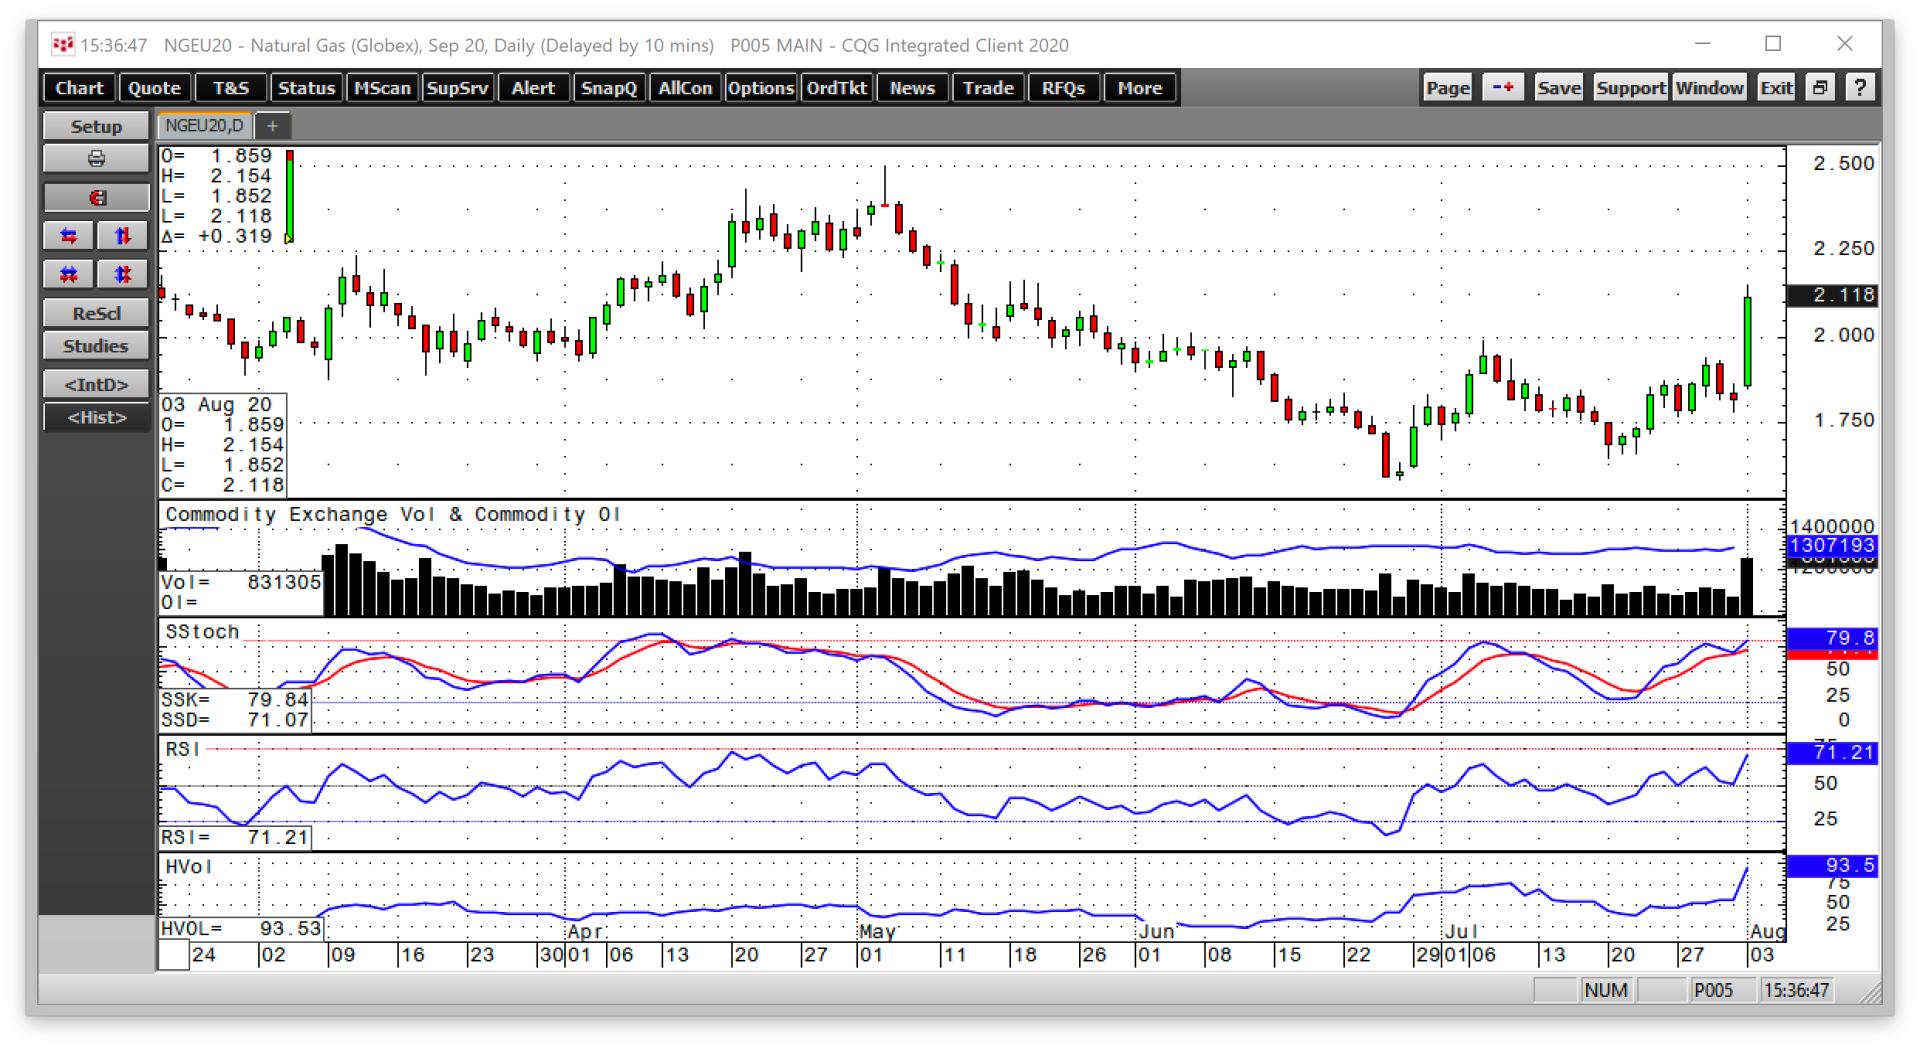
Source: CQG
As the daily chart highlights, natural gas has made higher lows and higher highs since late June. Meanwhile, a move above the July 7 peak at $1.989 was necessary to break the medium-term bearish trend. On the first trading session in August, September futures blew through that level like a hot knife through butter, trading to a high of $2.154 and settling at over $2.10 per MMBtu. Price momentum and relative strength indicators were moving towards overbought conditions. Daily historical volatility at the 99.6% level spiked higher on the dramatic move on Aug. 3. The open interest metric has been flatlining on either side of the 1.3 million contract level.
Even though the price action since late June has been constructive, the natural gas futures market remains in a bearish trading pattern since early May. A move above $2.162 is necessary to negate the bearish trend. The September futures stopped short of that level on Aug. 3. In June and July, the nearby futures contracts dropped to lows of $1.423 and $1.605 per MMBtu.
High Stock Levels and Weaker Demand Were A Bearish Cocktail For Energy Commodity, But Natural Gas Was Too Low
Both crude oil and natural gas have suffered under the evaporating weight of demand caused by the global coronavirus pandemic. Crude oil fell to an all-time low in April. Natural gas declined to its lowest price since 1995 in June.
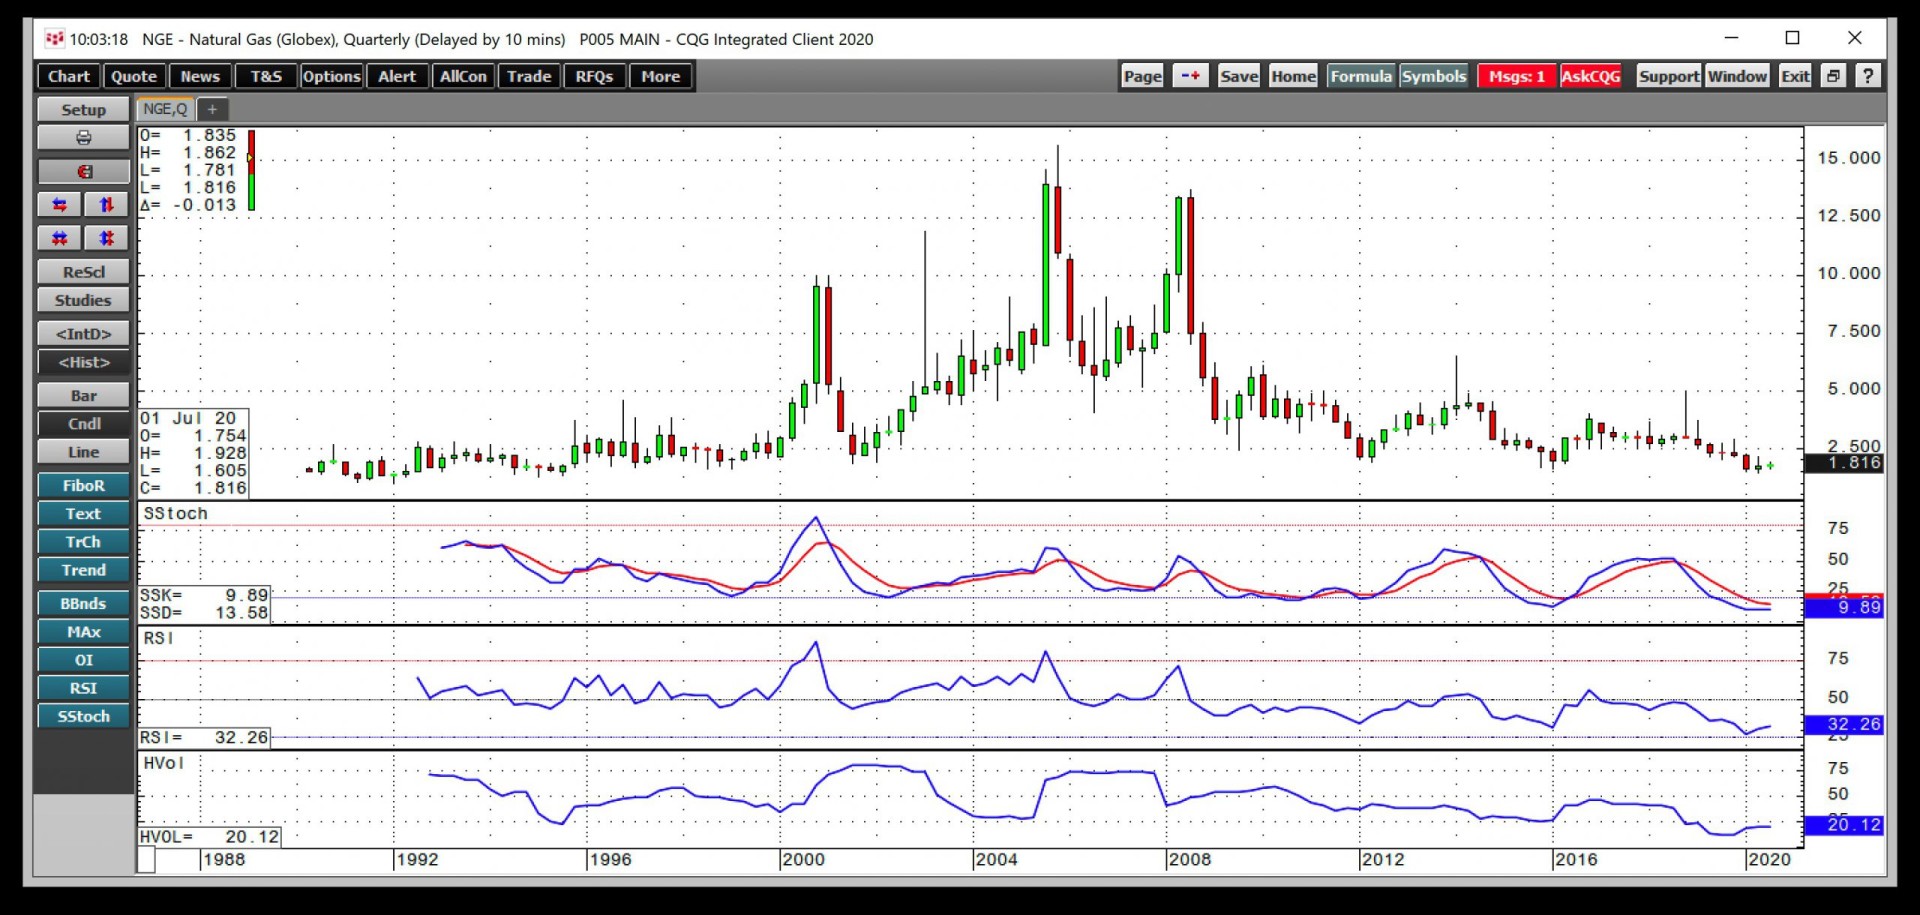
Source: CQG
The monthly chart shows that the lows in June and July were the lowest natural gas prices during those months of this century. The last time the energy commodity fell to a lower level in June was in 1991, and in July since 1995.
Stockpiles and demand destruction caused the price of natural gas to fall to the lowest level in decades over the past two months. However, at below $2, the price fell to a level that was too low as the peak season for demand starts in approximately four months.
Back Above $2, But Bears Are Likely To Return
The bearish tone in the natural gas market is likely to remain intact over the coming weeks and months, despite the Aug. 3 rally. Stockpiles seemed destined to rise to over the 4-trillion-cubic-feet level for only the third time since the Energy Information Administration began reporting data.
The first level of technical resistance stands at $2.162 on the continuous contract and $2.499 per MMBtu on September futures.
With the winter season of 2020/2021 on the horizon, natural gas tends to move higher as the withdrawal season that begins in November approaches. However, any rally is likely to attract speculative selling because of the high level of inventories and the market’s overall bearish tone. Over the coming months and into 2021, technical support stands at the recent $1.432 low. Below there, $1.335 and $1.25 per MMBtu are support levels from 1995.
In 2020, crude oil fell to a new all-time low. In the natural gas futures arena, the $1.02 level, the bottom from 1992, stands as the line in the sand on the downside as it is the all-time low since natural gas began trading on the NYMEX futures exchange in 1990. The move on Aug. 3 is a reminder for the bears that the risk of a short position increases the lower it falls.