Get 40% Off
⚠ Earnings Alert! Which stocks are poised to surge?
See the stocks on our ProPicks radar. These strategies gained 19.7% year-to-date.
Unlock full list

Markets Struggle To Build On Monday's Bullish Hammers; More Losses Likely

Published 12/12/2018, 12:15 AM
Updated 07/09/2023, 06:31 AM

It was a good finish for bulls on Monday but yesterday there was a lack of follow-through on what should have been a good day for buyers. However, damage was still relatively light. Technicals for the S&P reverted to a net bearish state as other indices lost ground.

The S&P cut into Monday's spike low but not enough to negate the bullish hammer. I would look for another spike low and would measure risk on a break of 2,580.
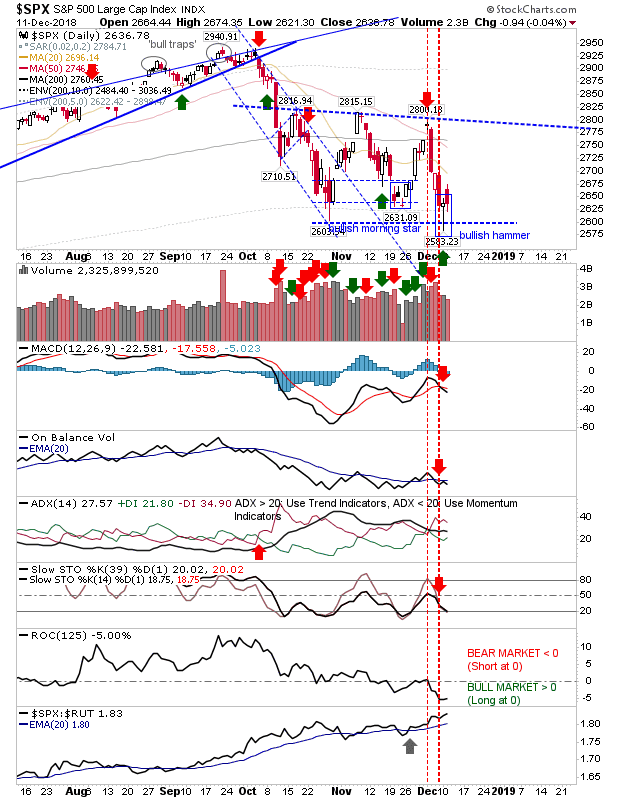
SPX Daily Chart


The NASDAQ closed with a 'black' candlestick, typically a bearish candlestick. Volume was at least lighter although there was a MACD trigger 'sell'. On the good news front, relative performance to Large Caps ticked higher so the index may start to benefit from some sector rotation.
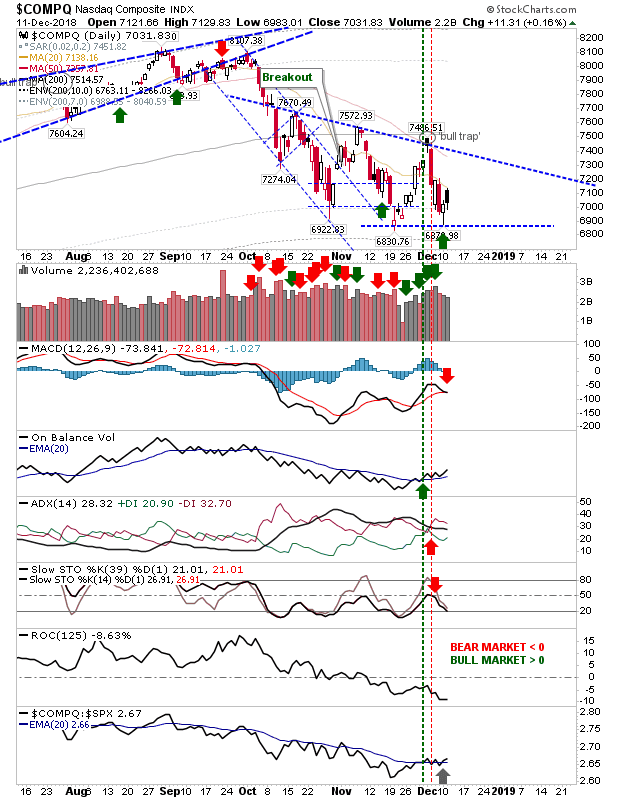
COMPQ Daily Chart


The Russell 2000 was the only index to undercut Monday's low before it managed a recovery. Yesterday's candlestick finished as a neutral 'doji' but there should be good support at 1,420 which will help bulls looking to fish for orders near the lows of the last couple of days. Traders should watch this closely, there is potential for a decent long trade.
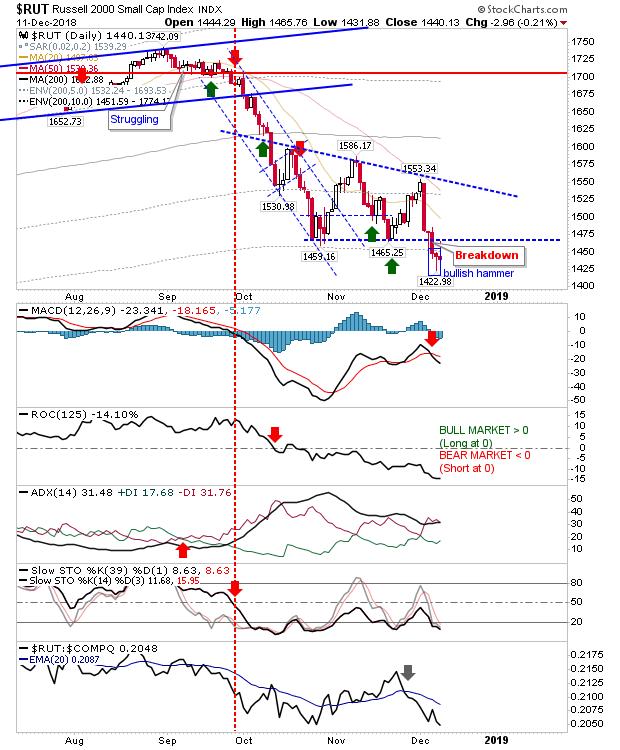
RUT Daily Chart


Investors can keep buying here as markets remain in an accumulate zone, with the Russell 2000 down in the 10% block of historic underperformance relative to its 200-day MA.

Longer term charts are looking more onerous. The performance of the relative relationship between the Dow Jones Industrial Average and the Transports Index has swung back to bears—the ratio is trading at horizontal support but is looking vulnerable to a breakdown. This relationship has been struggling since 2015; the economy is not shipping the number of goods required to keep it afloat; recession beckons.
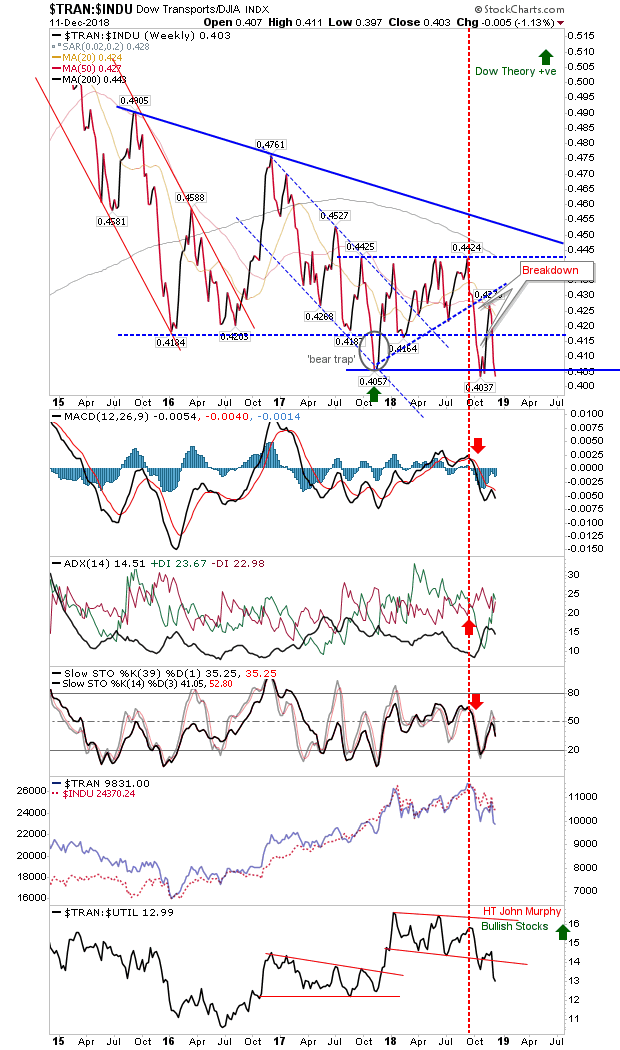
TRAN:INDU Weekly Chart


The monthly S&P is on a 'sell' trigger but the percentage of S&P stocks above its 200-day MA has not reached a buy zone yet.
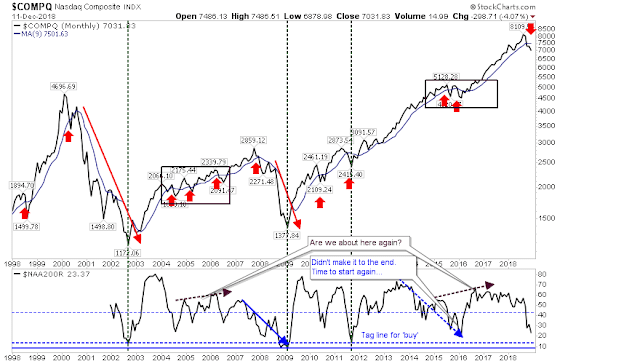
COMPQ Monthly Chart


U.S. unemployment has nowhere to go but up. Consumer sentiment is not looking great either.
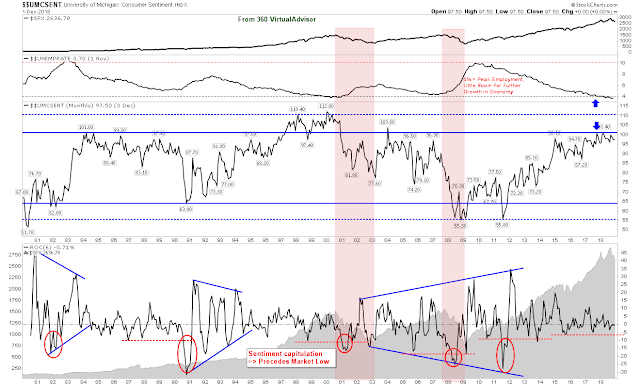
UNEMSENT Daily Chart


Trouble all around with a weak President to lead. How long before things turn into a rout? Investors should keep dipping their toes on the buy side but further losses still look likely.

Latest comments

How much of a pull-back would we get after the "trade-talk saga" gap-up on Wednesday (today) morning?. Would we retrace the full gap-up? Or would we go lower into "another spike low" as you mentioned? Of course, you wrote the article without knowing about the positive trade talk saga ..=== I've seen pullbacks all the way back to the opening as in TLRY when it doubled up a 100% from its opening price, and I've seen gap-up pullbacks to Fib 38% (counting from 0% low to 100% high).== Maybe you could comment. Thank You.
Great thanks!! Are you going into politics now? Trumph was the greatest thing that could happen to the markets;-)
Risk Disclosure: Trading in financial instruments and/or cryptocurrencies involves high risks including the risk of losing some, or all, of your investment amount, and may not be suitable for all investors. Prices of cryptocurrencies are extremely volatile and may be affected by external factors such as financial, regulatory or political events. Trading on margin increases the financial risks.
Before deciding to trade in financial instrument or cryptocurrencies you should be fully informed of the risks and costs associated with trading the financial markets, carefully consider your investment objectives, level of experience, and risk appetite, and seek professional advice where needed.
Fusion Media would like to remind you that the data contained in this website is not necessarily real-time nor accurate. The data and prices on the website are not necessarily provided by any market or exchange, but may be provided by market makers, and so prices may not be accurate and may differ from the actual price at any given market, meaning prices are indicative and not appropriate for trading purposes. Fusion Media and any provider of the data contained in this website will not accept liability for any loss or damage as a result of your trading, or your reliance on the information contained within this website.
It is prohibited to use, store, reproduce, display, modify, transmit or distribute the data contained in this website without the explicit prior written permission of Fusion Media and/or the data provider. All intellectual property rights are reserved by the providers and/or the exchange providing the data contained in this website.
Fusion Media may be compensated by the advertisers that appear on the website, based on your interaction with the advertisements or advertisers.
© 2007-2024 - Fusion Media Limited. All Rights Reserved.