Traders were not impressed by Trump's speech during his State of the Union Address late Tuesday as the dollar stayed muted. On the contrary, the dollar got a boost with comments from Fed officials who also spoke yesterday which brought the focus to the potential March rate hike. Fed Chair Janet Yellen will be speaking later this week on Friday and could shed more light on the Fed's intentions for rate hikes. SF Fed President, John Williams and NY Fed President William Dudley were both seen supporting the case for a rate hike during two separate TV interviews.
The economic calendar is busy with the start of a new month. UK's manufacturing PMI numbers along with data from Europe will be coming out during the day, while the Bank of Canada's monetary policy meeting is likely to be the main highlight. Data from the U.S. will see the release of the ISM manufacturing PMI numbers for the month of February.
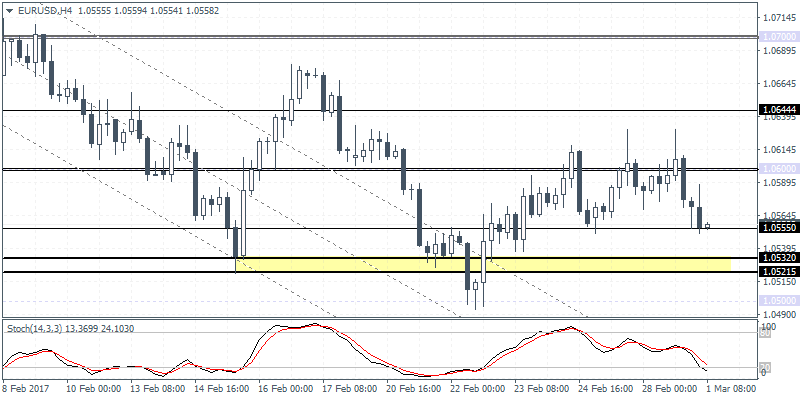
EUR/USD intra-day analysis

EUR/USD (1.0558): continues to stay directionless with prices seen falling back after testing the 1.0600 resistance level. At the time of writing, EUR/USD is testing the lower support at 1.0550,but a breakdown below this level could trigger further declines towards 1.0500. The U.S. dollar is looking bullish today and with anew set of economic reports coming out, expect to see some volatility in prices as the U.S. ISM manufacturing report data is due later this afternoon with expectations showing another increase in the index.
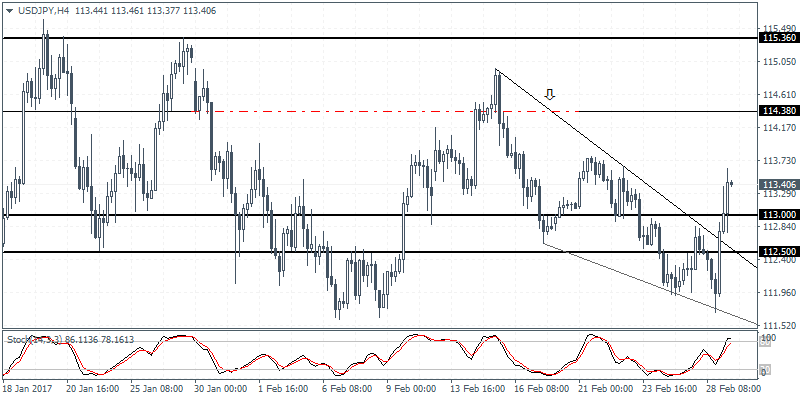
USD/JPY intra-day analysis

USD/JPY (113.40): formed a doji yesterday and prices were rejected near the 112.00 support level. At the time of writing, USD/JPY is seen posting strong gains, but the price could likely struggle near the 114.00 resistance level. Further gains can be expected only on a breakout above 114.00, in which case we can anticipate the bullish momentum to continue pushing the dollar towards 118.00. Watch for any dips towards 113.00, which could see support being established, while in the near term, resistance at 114.38 will be the likely upside target for the dollar.
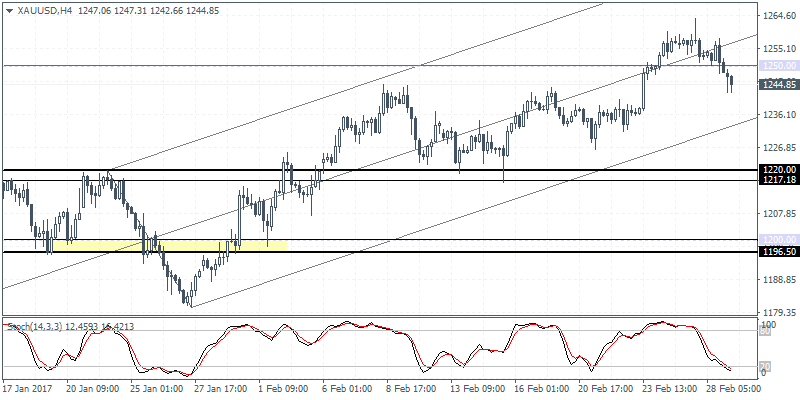
XAU/USD intra-day analysis

XAU/USD (1244.85): Gold prices extended the declines for two consecutive days with early Asian trading session already showing a bearish sentiment in the precious metal. With the technical support of 1250 being breached, gold prices are likely to decline towards 1220.00 especially head of what could be a hawkish speech from Fed Chair Janet Yellen this Friday. Therefore, any pullbacks, especially to 1250 will be met with resistance while support at 1220.00 will act as the initial support for the prices. A breakdown below 1220.00 could signal further declines down to 1200.00 which remains elusive so far. However, watch for a daily break down below 1241.00 which marks the daily support level which could be the trigger for the downside.
