The US dollar was seen trading close the week on a mixed note. Economic data released on Friday showed that the personal consumption expenditure rose at a weaker than expected pace.
The headline PCE index rose just 0.1% on the month, below estimates of 0.2%. On a year over year basis, the PCE rose 1.3%, slightly below 1.4% that was registered the month before while the core PCE grew at the same pace of 1.4% as the previous month.
Over the weekend, the Catalonian referendum was the major event. Despite the courts calling it unconstitutional, the referendum went ahead with the results showing over 90% of the voters backing for statehood. The weekend referendum was met with chaos and violence.
Looking ahead, the new trading week and a month, as well as the quarter, is likely to see speculators focusing on the upcoming fundamentals. In the US, the ISM's manufacturing PMI is expected to be released this week.
Economists expect that index to fall to 58.0, down from 58.8 in August which marked a 6-year high. From the Eurozone, the services and manufacturing PMI will also be released today.
EUR/USD Intraday Analysis

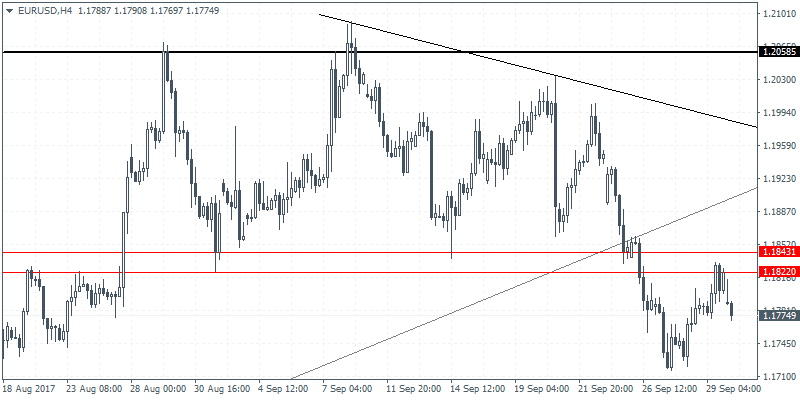
EUR/USD (1.1774):Although the EUR/USD managed to post some gains towards Friday, price action stalled near the resistance level of 1.1822. Initial signs show a reversal at this level, but this could be confirmed only on a daily bearish close off the 1.1822 resistance level. The next support level is seen at 1.1688, followed by a decline to 1.1440. The decline to 1.1688 will mark the 161.8% measured move of the descending triangle. Thus, we could expect price action to potentially at this level before moving into a sideways range for the near term.
GBP/USD Intraday Analysis

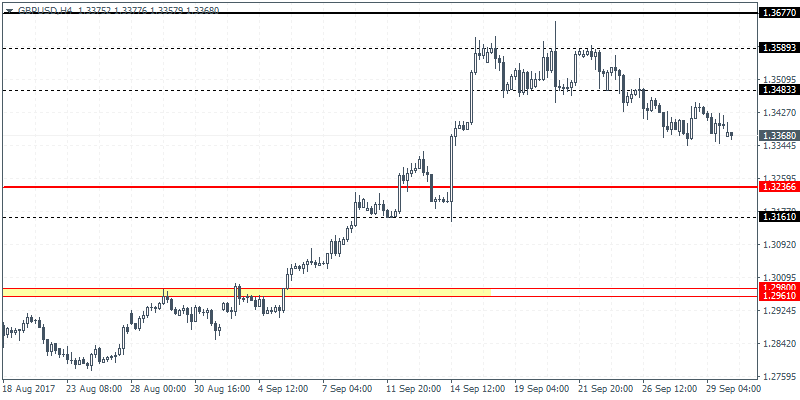
GBP/USD (1.3368):GBP/USD is seen opening on a weaker note this morning following the downside breakout in prices below 1.3483. We expect the declines to continue towards the lower support level at 1.3236. Price action has broken to the downside following the failure of the bullish flag pattern. The correction to 1.3236 marks a retest of the previously breached resistance level. Establishing support here could keep prices range bound, but further downside cannot be ruled out. The next lower support is seen at 1.3161 which could potentially be tested as well.
USD/JPY Intraday Analysis

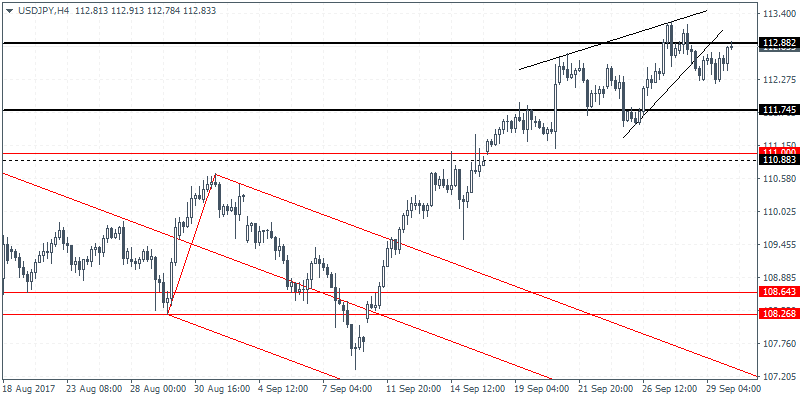
USD/JPY (112.83):The USD/JPY managed to post some gains although price action struggles to breakout from the resistance level of 112.88. The 4-hour chart shows the ascending wedge pattern from which price broke out briefly before retracing these losses. As long as price does not breakout from the resistance level, we can expect to see some downside price action. The rising wedge pattern will be validated on a decline towards the support level of 111.74. A breakout above 112.88 could, however, invalidate the bearish wedge pattern with price action likely to test further highs.
