Get 40% Off
🚨 Volatile Markets? Find Hidden Gems for Serious OutperformanceFind Stocks Now

Markets Continue Seeking A Low; Key Metric Will Be Selling Volume

Published 03/23/2020, 01:10 AM

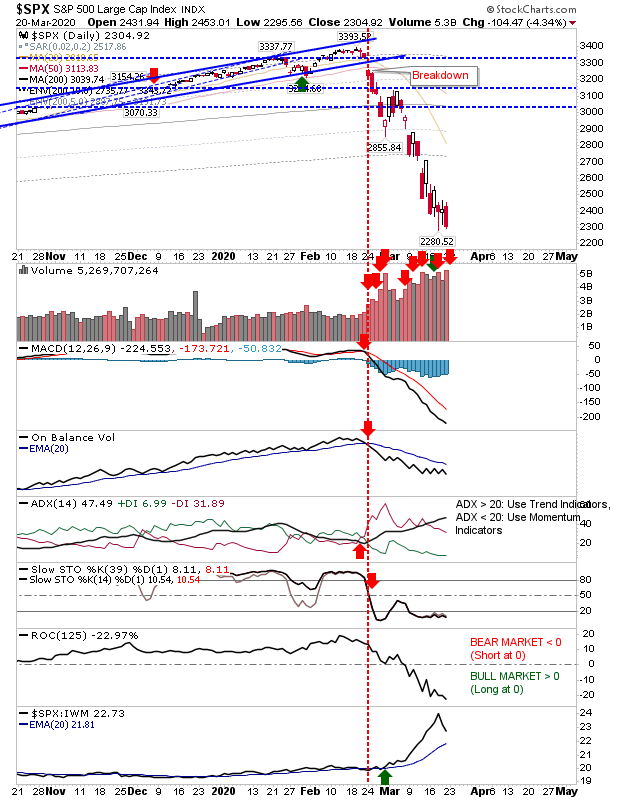
Wednesday had offered the opportunity for the start of a swing low following a 'bullish' hammer in the S&P, but there were more indecisive candlesticks in the NASDAQ and Russell 2000, and with Friday's selling coming on the back of higher volume—although this coincided with a Triple witch for options expiration—undermined any possible demand mid-week action could have hinted at.

Markets are again in a situation seeking a low, and with key indices finishing near the week's lows (likely awaiting news over the weekend), the chance for yet another gap down today looks high.  What will be important will be the selling volume—we want to see some exhaustion (light volume) on down days, followed by higher volume buying on days markets are able to close higher.

The S&P looks like it will gap down later today; failed 'bullish hammer's have a nasty habit of trying to seek new lows. The only thing 'to like' here is the relative underperformance against the Russell 2000; if traders are moving back to more speculative stocks it might raise the opportunity for a more sustained low.
SPX Daily Chart

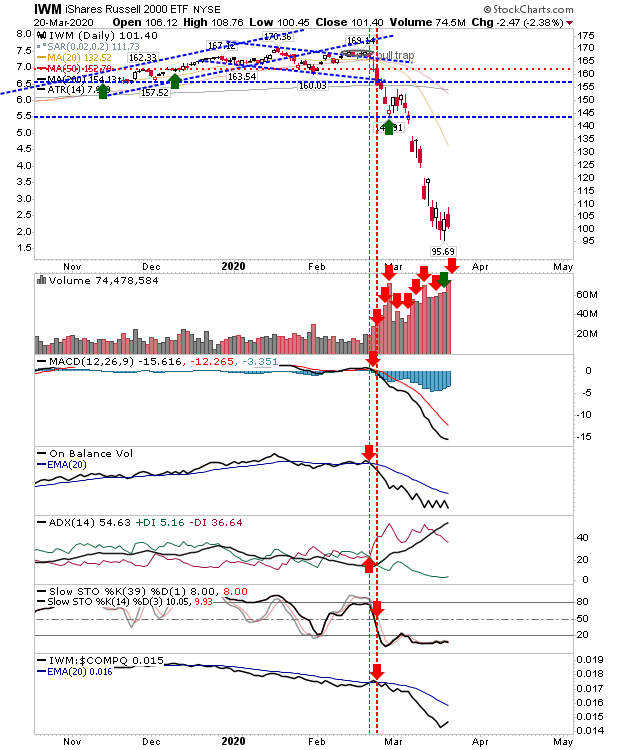
Speaking of the Russell 2000 (or at least, the ETF,  iShares Russell 2000 Fund (NYSE:IWM)), Friday's selling was relatively muted. It has managed to establish a nascent low, although Friday's 'bearish cloud cover' pattern can't be allowed to develop. Friday's volume was some of the highest it has experienced since the crisis began—which is nearly five times the volume of pre-crisis.
IWM Daily Chart

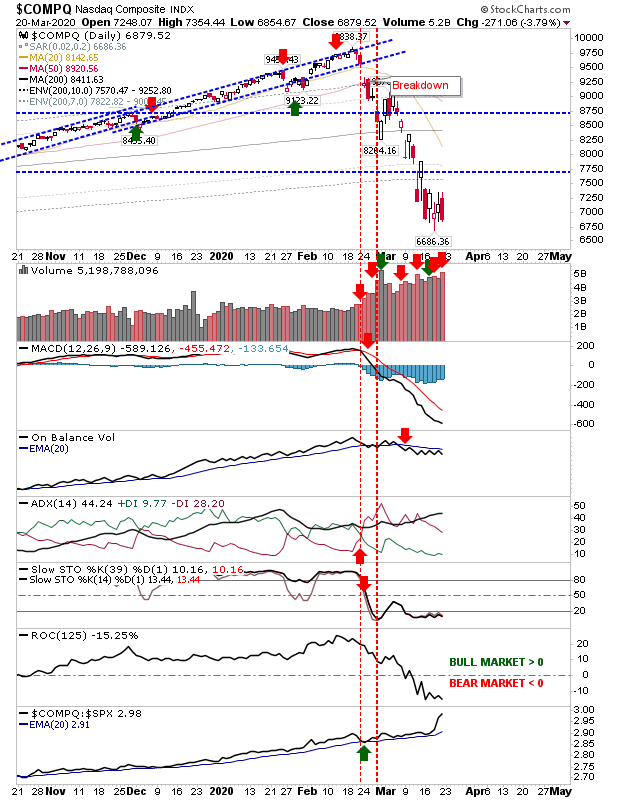
The NASDAQ finished with a engulfing pattern, although this pattern is only considered bearish as a reversal pattern in an overbought condition, and we are long way from that! However, the NASDAQ is outperforming the S&P and the mid-week low is still intact.
3rd party Ad. Not an offer or recommendation by Investing.com. See disclosure here or remove ads .

COMPQ Daily Chart

While breadth metrics are also weak, NASDAQ Bullish Percents have been ticking higher, despite the loss in the parent index. It's one of the few positives in a sea of negatives.BPCOMPQ Daily Chart
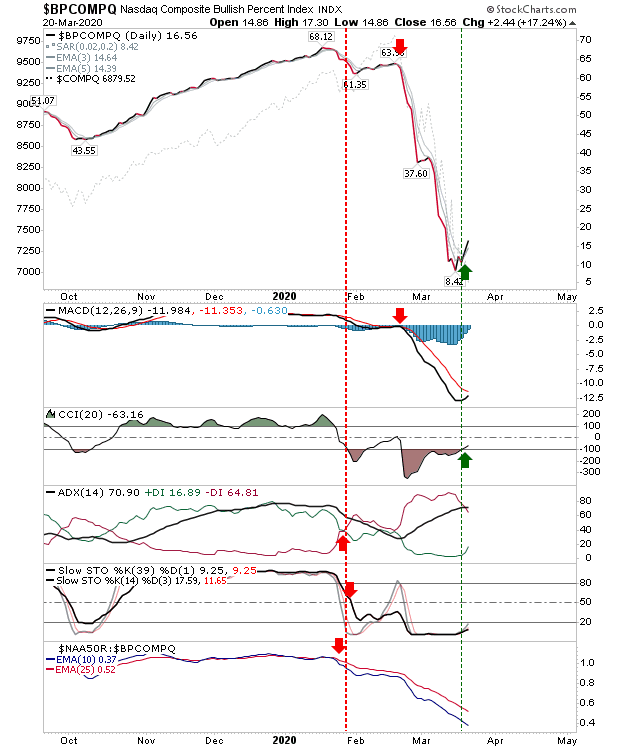
For today, the S&P has set up for a gap down, but the Russell 2000 still has an opportunity to continue its swing low. Breadth metrics are heavily oversold, but they have been in this situation for a long time now...

Latest comments

Look no one can call a bottom. Technicals get thrown out the window but when the market pulls back 35% you start taking stabs if you haven't already. I liquidated 3/4 of my long positions between 2/7-2/27 and kept only some well paying dividend plays. By 3/9 I was starting to nibble. If it goes down more, guess what? I'll buy more. His articles were informative on the RUT. I've added some to the SMDV and bought up the mutual fund VYM all exposed to the RUT. Picked up JETS for long term exposure to the airlines, GOLD, SAND, XLP, XLU, CLF, MPW, CIBR Tomorrw I'll start hitting the blue chips like DIS, Hormel and msft I'm minimal 5 years out looking for a 25% return and 10-15 years out looking for 35-50%
The author predicted a top right before the big drop, from what I remember
In the past 4-5 months nobody could predict this will develop as it has. Easy to talk and be critic with tomorrow's newspaper. Thanks Declan for your awesome articles.
Lolzz. My point was that he should have stopped saying BUY. I didn't say he needed to say SHORT. He couldn't have nor you. Because you just follow technicals
How do you know what I follow?😆no, I don't, but every tool helps, and personally believe his tech analysis is great, been following him for years. Good luck to you and all, stay safe!
You should have stopped writing articles by now. In past 4-5 months you were always saying it's buy, buy & buy!
If you watched fundamentals whats the mystery? The economy is locking down for the worst recession in history, weve barely begun the process? Whats the point of touting a key volume metric - so you can BUY? Will that indicate its all over? We’re going ro be going down for a lot longer so whats the point of waiting for a momentary pause?
know it all
It may rain, it may not. Rolling the dice on future performance is futile at this time.Pull out and sit. Then relax.
Risk Disclosure: Trading in financial instruments and/or cryptocurrencies involves high risks including the risk of losing some, or all, of your investment amount, and may not be suitable for all investors. Prices of cryptocurrencies are extremely volatile and may be affected by external factors such as financial, regulatory or political events. Trading on margin increases the financial risks.
Before deciding to trade in financial instrument or cryptocurrencies you should be fully informed of the risks and costs associated with trading the financial markets, carefully consider your investment objectives, level of experience, and risk appetite, and seek professional advice where needed.
Fusion Media would like to remind you that the data contained in this website is not necessarily real-time nor accurate. The data and prices on the website are not necessarily provided by any market or exchange, but may be provided by market makers, and so prices may not be accurate and may differ from the actual price at any given market, meaning prices are indicative and not appropriate for trading purposes. Fusion Media and any provider of the data contained in this website will not accept liability for any loss or damage as a result of your trading, or your reliance on the information contained within this website.
It is prohibited to use, store, reproduce, display, modify, transmit or distribute the data contained in this website without the explicit prior written permission of Fusion Media and/or the data provider. All intellectual property rights are reserved by the providers and/or the exchange providing the data contained in this website.
Fusion Media may be compensated by the advertisers that appear on the website, based on your interaction with the advertisements or advertisers.
© 2007-2024 - Fusion Media Limited. All Rights Reserved.