At the moment of writing we are still waiting for the data out of China, which could cause for a reaction in the markets if it is differs too much from the expectation.
Currencies
EUR/USD – reached the resistance around the 1.116 level an after reaching this level moved down. It is trading around the 1.105 level in recent days. We are not getting a lot of important data out of the Eurozone or the US, but this will change on Friday.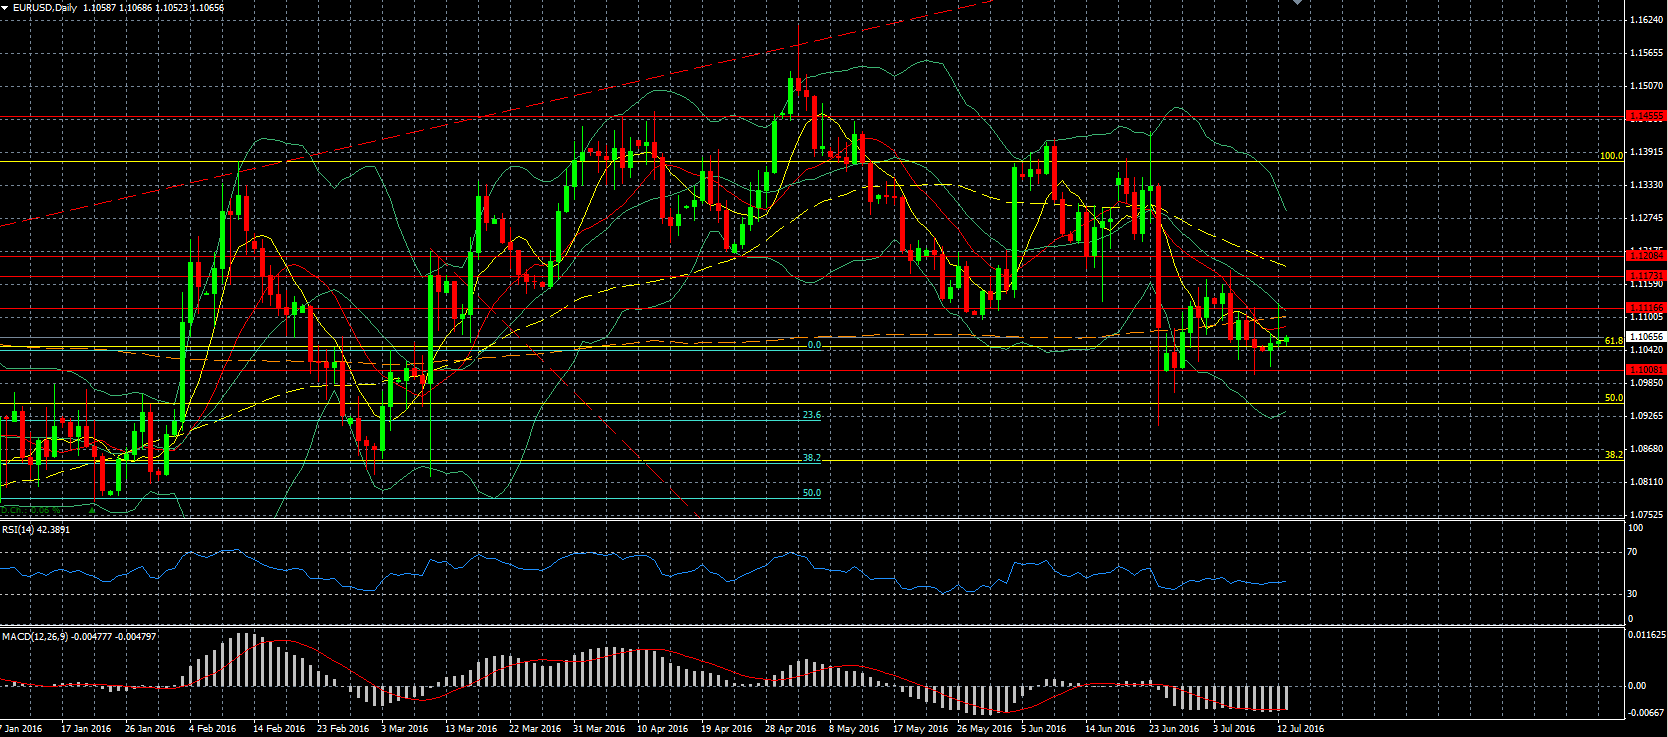
USD/JPY – moved up all the way to the resistance around the 104.9 level before moving down today. There remains some uncertainty of what measures Japan will take to boost its economy, with some saying that so-called helicopter money will be used, which is denied by others. In any case we should know more by the end of the month, when PM Abe said he would announce his plans and also the BOJ will make its decision.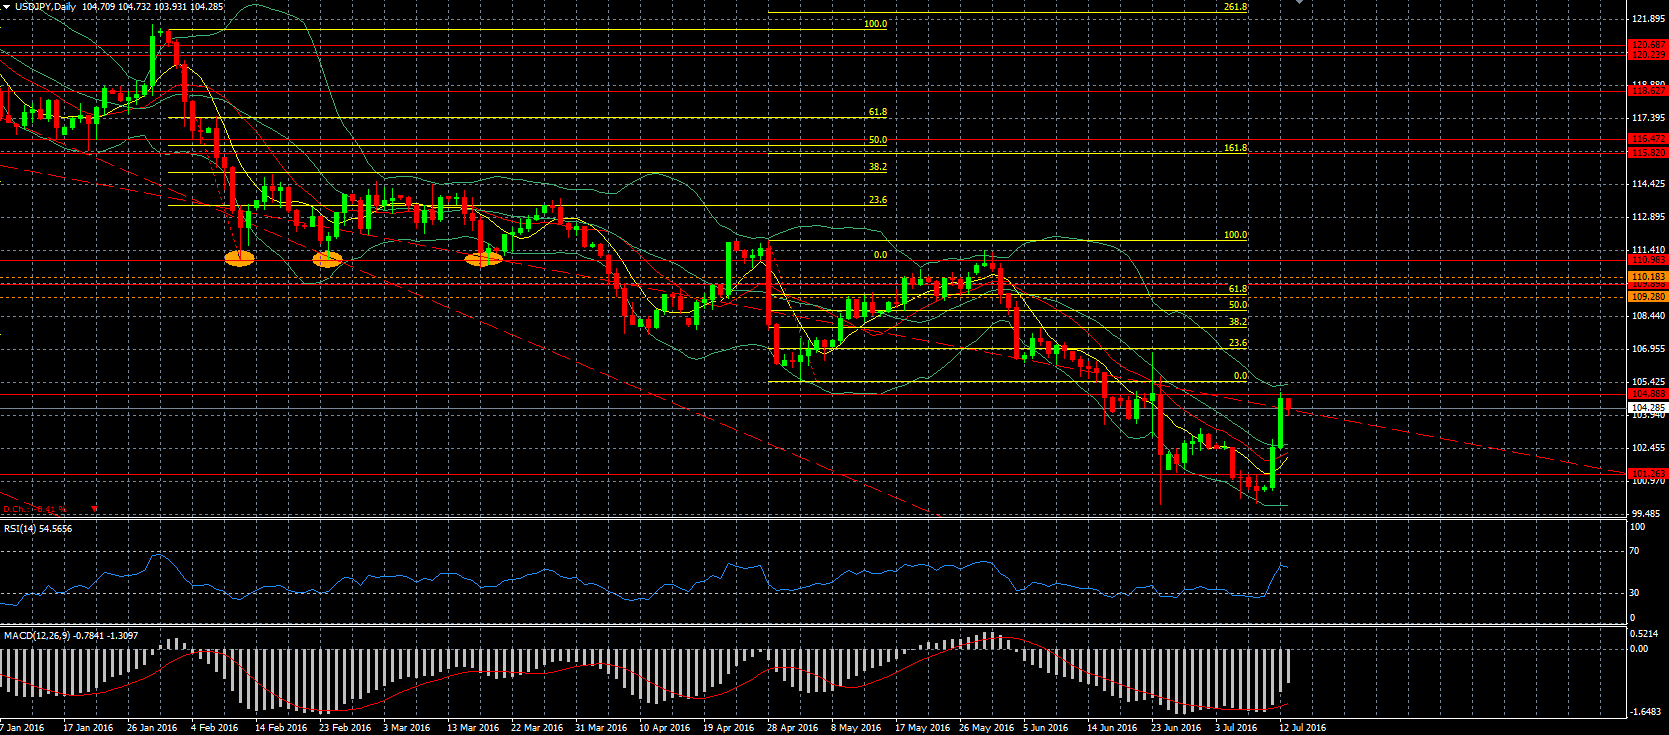
GBP/USD – continues to move higher as there is some more political stability with PM Cameron who will resign today and Theresa May will become the new PM. From then on we will focus on the interest rate decision of tomorrow by the BOE, which is widely expected to be a rate cut of at least 0.25%. BOE Governor Carney said yesterday that a weaker GBP is helping the economy, and as such a rate cut should assist to weaken the GBP further.
USD/CAD – will be awaiting the interest rate decision and especially its monetary policy report.
USD/AUD – at the time of the writing we are still awaiting the data out of China which is important, and tomorrow night/morning we will have the employment data out of Australia.
Indices
DAX 30 – was able to break through the resistance around the 9815 level and also shortly broke through the psychological 10,000 level but was unable to hold on to this level. The next resistance can be found around the 10,038 level.
Dollar Index – saw another attempt to break through the resistance around the 96.55 level but was unable to do so.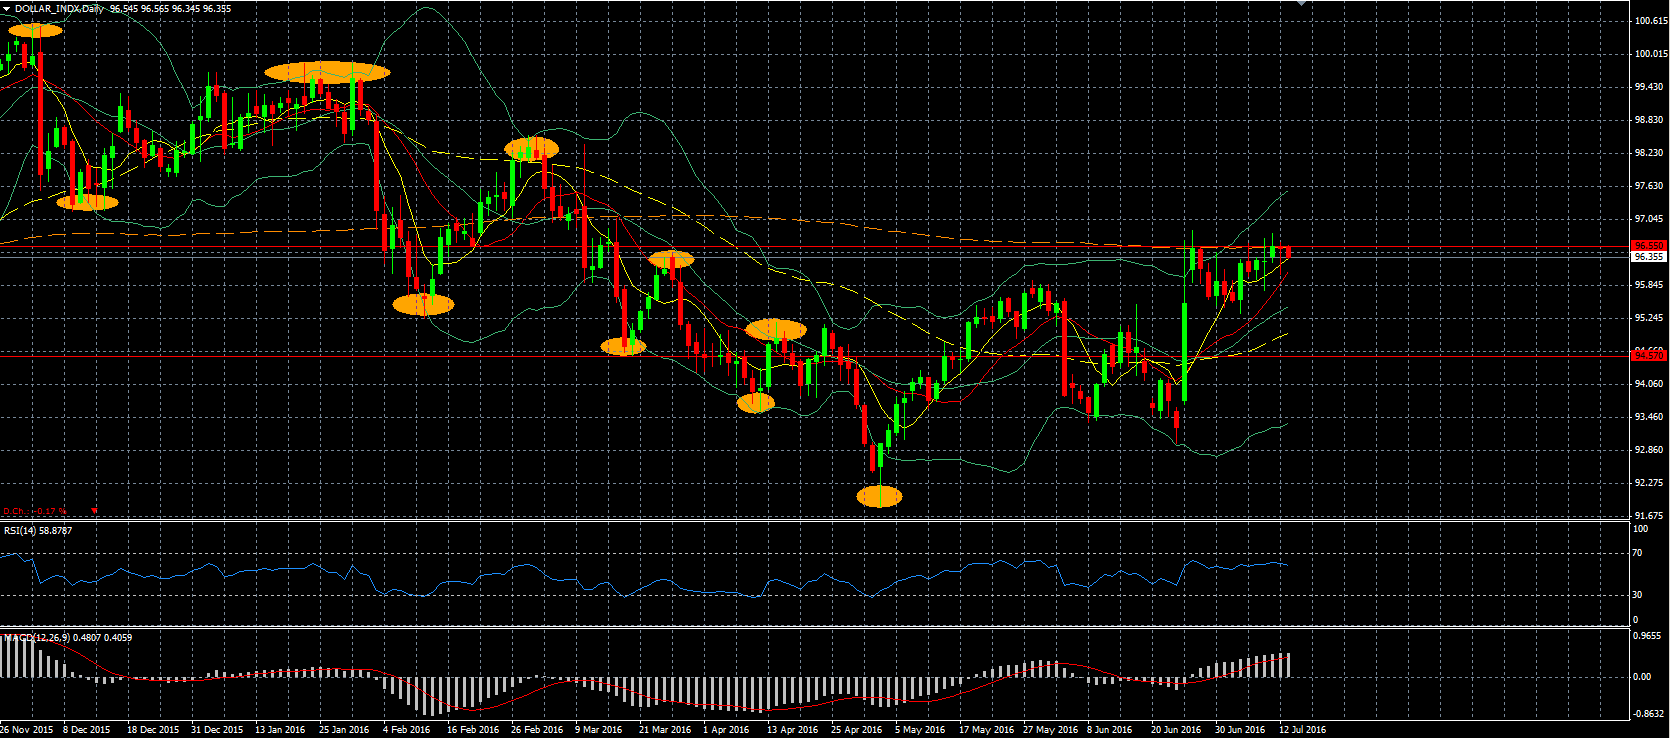
S&P 500 – continued to move up and as a result marked again a new all-time high, mainly boosted by the energy sector.
Commodities
Cotton – soared to a 2 year high amid lower expected stocks as reported by the WASDE report. This is due to a combination of lower production and higher consumption.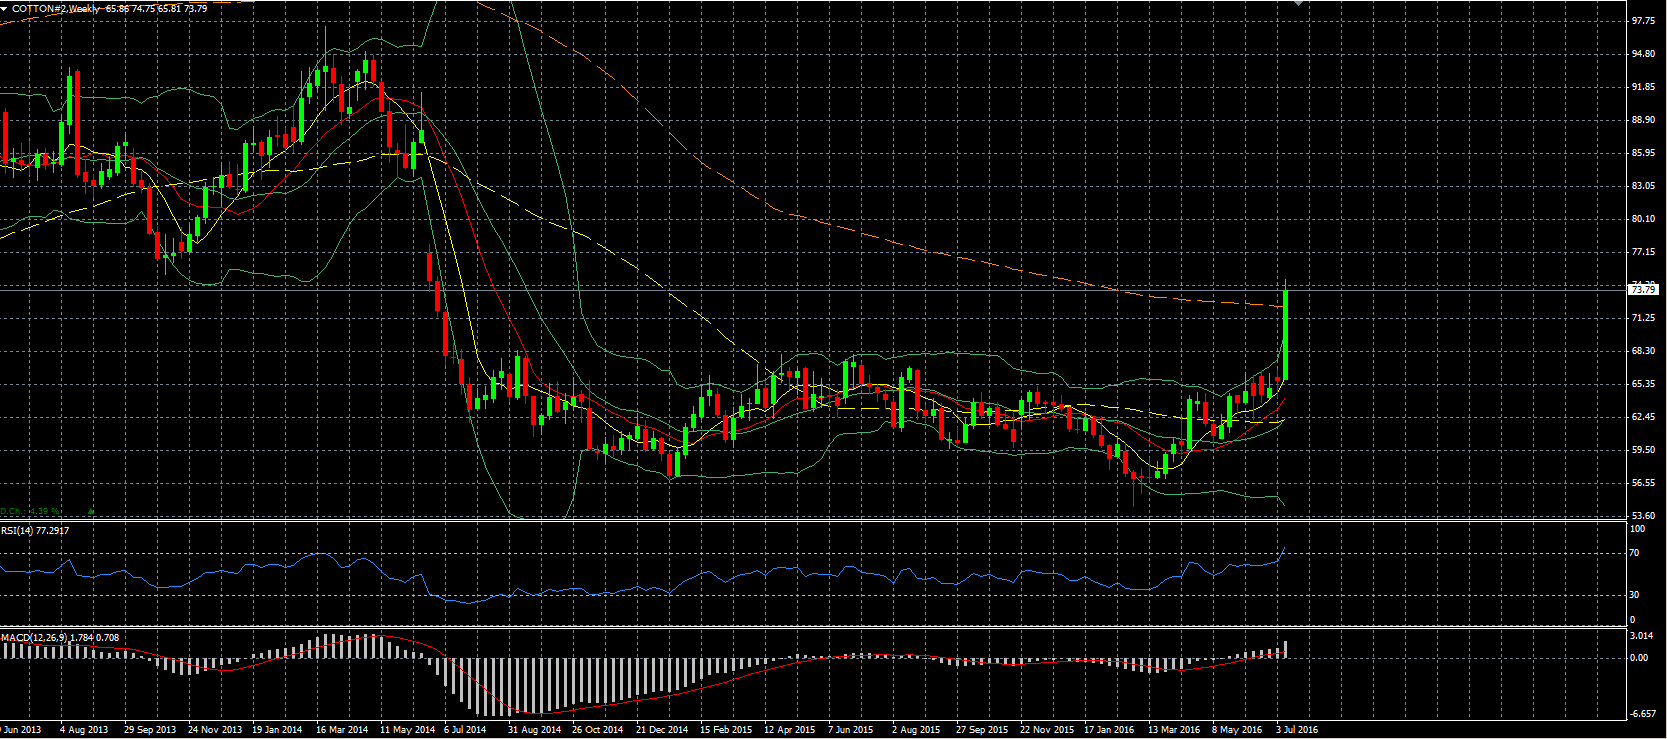
Gold – the rise in the equity markets has taken some steam out of gold and as a result we saw the largest 2 day drop in a while.
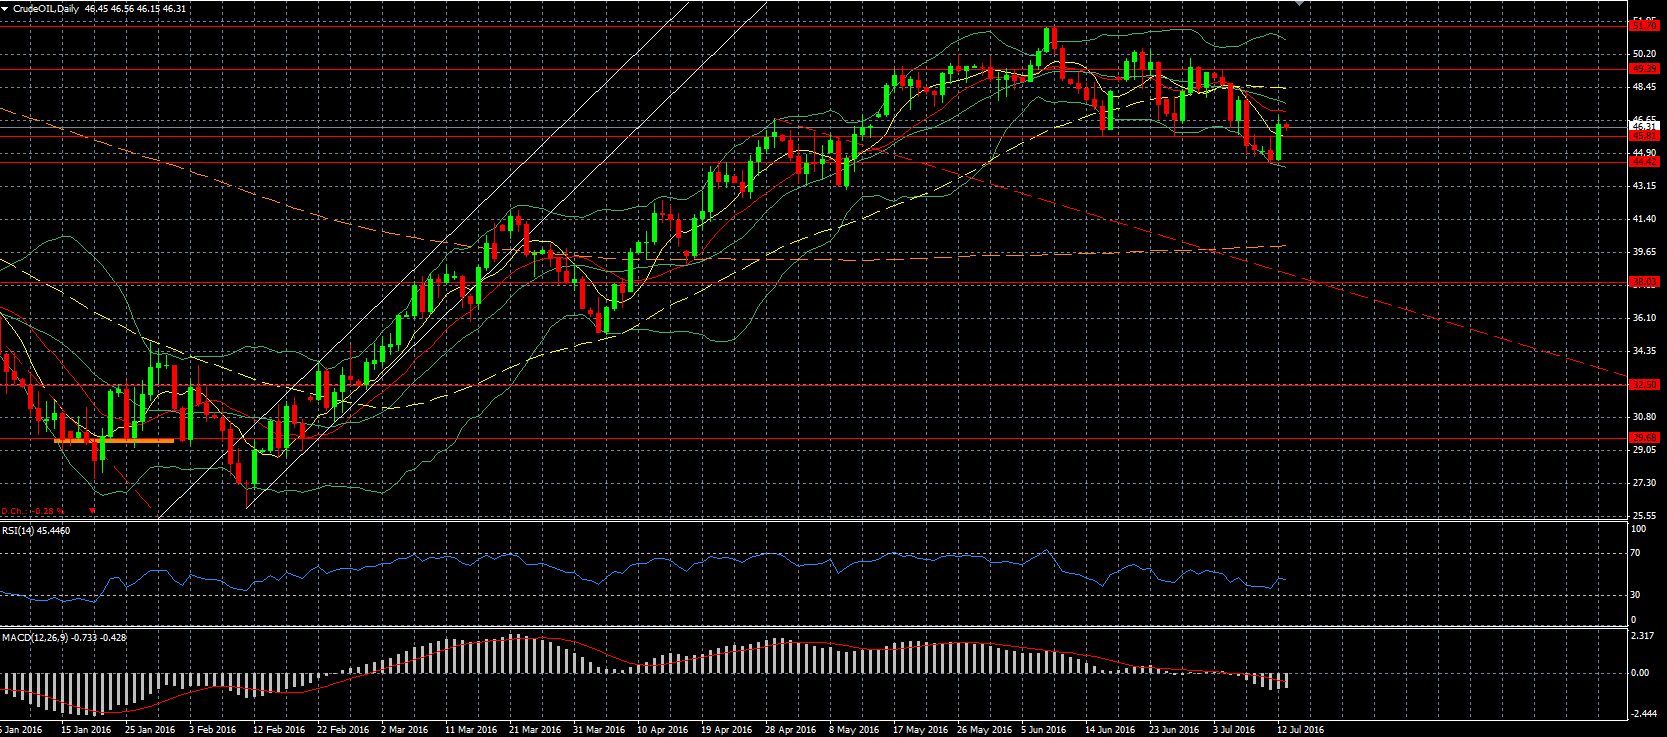
Oil – moved sharply up yesterday after once again reaching the support around the 44.42 level. It breached the resistance around the 45.80 level as the forecast is for increased demand next year, even though for this year that is not the case and production is also expected to increase. We are currently moving down as the crude stock showed a surprising build of around 2 million barrels. If the inventories will also show a build we can expect oil to move down again to test the support around the 44.42 level as we are likely to first test the breached resistance at 45.81 from above.