Get 40% Off
👀 👁 🧿 All eyes on Biogen, up +4,56% after posting earnings. Our AI picked it in March 2024.
Which stocks will surge next?
Unlock AI-picked Stocks

Market Top Or Simply A Correction?

Published 09/08/2020, 12:36 AM
Updated 07/09/2023, 06:31 AM

YM Daily Chart

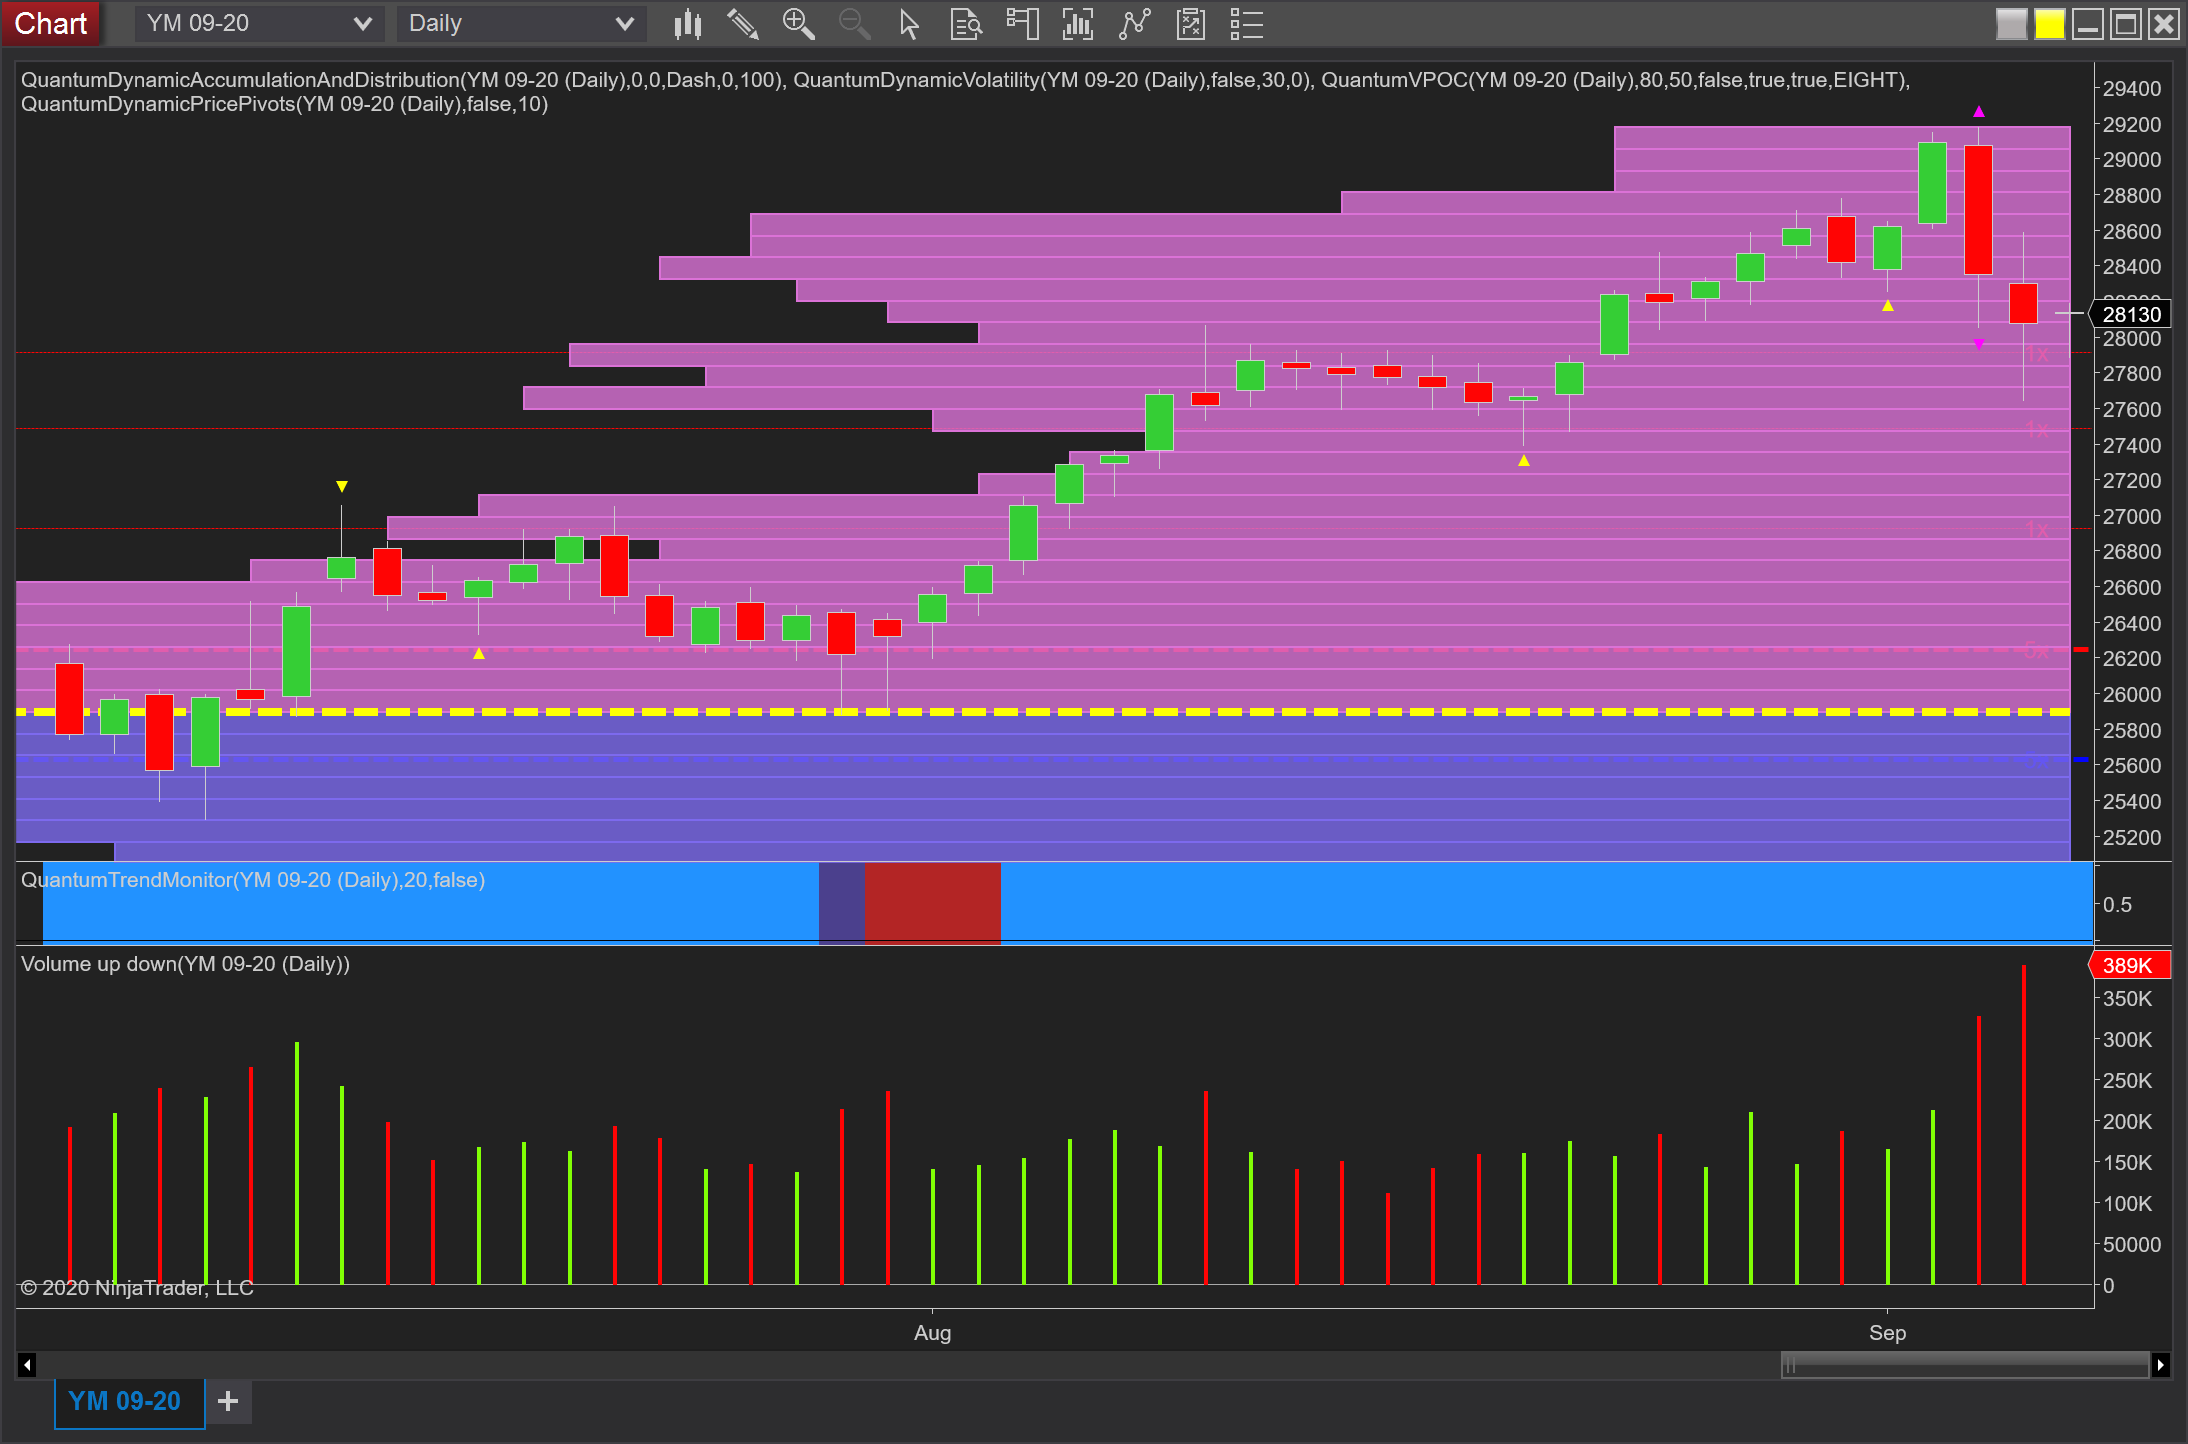
An interesting end last week for US equity traders and investors, probably more so for the former and less so for the latter who are no doubt grateful for a relatively quiet day yesterday with the US and Canada on holiday. And whilst all three indices are exhibiting similar price action, I want to focus on the daily chart for the YM emini, and as always volume reveals the true picture and the way ahead.

As we can see from the chart, Thursday’s sharp sell-off was dramatic and terrific for index traders, but note the closing volume on the day, which whilst ‘high,’ was not as high as we might have expected given the range of the candle and certainly not extreme. In addition, the wide spread down candle also triggered the volatility indicator, with the purple triangles at the top and bottom of the candle not only signalling the price action had moved outside the average true range but also flagging the likelihood of congestion back within the spread of the candle or even a reversal higher.

Friday’s price action, therefore, came as no great surprise with the contract closing with a doji candle but on very high volume, with the body of the candle closing within the spread of the previous day. And whilst the Doji candle signals indecision and represents the battle between buyers and sellers, what is perhaps more significant is the fact the market recovered well off the lows of the day.

Had the selling pressure continued from the previous day, this candle would have closed as a wide spread down candle. The fact it did not tells us the buyers moved in strongly, as was the case for both the NQ and ES emini contracts, which too had plunged early in the session, only to recover a large percentage of these losses later in the session. The price action and volume also confirmed the market makers were stepping in to buy as panic selling ensued.

3rd party Ad. Not an offer or recommendation by Investing.com. See disclosure here or remove ads .

Given this scenario, what we can now expect to see is a recovery in the short-term with the last few days simply a chance for the market makers to trigger panic selling freeing up stock for a further advance and extension of the longer-term bullish trend.

Latest comments

have been invested for 51 years after i got my first paycheck as a young engineer and bonus from my employer - i started with Mutual Funds at Fidelity and Vangard then some broad market ETF. I read but never follow any financial comentary i watch some financial channels for entertainment value - after 51 years my average is + 11.8% with a high of 38% and a low of - 11% - i was able to send two kids to grad school / buy properties in New york / a house on a private island in Miami Beach and a flat In London. I am writing this note from a 27 meters chartered sailing yacht facing the island of Milos in greece. Every hard working person can do that - just stick to one strategy - be patient - DO NOT FOLLOW financial advise DO NOT over complicate things - the more charts the more screen the lower the results.
But what if i dont want to wait 50 years before im on a yacht
Invested for 51 years and market is up buy 3000% while you made only 11%. All that is seriously, a bluff...
You don’t even know basic math. G o and educate y ourself.
Anna coulling is my teacher of VPA. Extremely powerful in combination with larger time frame price action and momentem trend indicators. She is one hall of frame charty.
Hi babe haw are you to day
Thank you for your analysis, and while I agree that there might be a short term bounce, perhaps even to previous highs, there are simply too many investors who missed selling at the prior top who would provide ample supply at (or even near) that level just to break even. Thus I don’t agree with your conclusion that there will be an extension of the longer term bull trend, at least not until after the election. Just too much uncertaintly about the Jan election (that’s when the Nov election will be decided by the Supreme Court), a reliable and SAFE vaccine that masses would actually take, and diminishing returns of Feds all over the globe. For the markets to continue climbing, it would likely require sector rotation, and I am not sure how many are willing to wait for financials and/or energy to advance in a meaningful way, much less small caps.
News will be even better from now on. Expect new records.
Risk Disclosure: Trading in financial instruments and/or cryptocurrencies involves high risks including the risk of losing some, or all, of your investment amount, and may not be suitable for all investors. Prices of cryptocurrencies are extremely volatile and may be affected by external factors such as financial, regulatory or political events. Trading on margin increases the financial risks.
Before deciding to trade in financial instrument or cryptocurrencies you should be fully informed of the risks and costs associated with trading the financial markets, carefully consider your investment objectives, level of experience, and risk appetite, and seek professional advice where needed.
Fusion Media would like to remind you that the data contained in this website is not necessarily real-time nor accurate. The data and prices on the website are not necessarily provided by any market or exchange, but may be provided by market makers, and so prices may not be accurate and may differ from the actual price at any given market, meaning prices are indicative and not appropriate for trading purposes. Fusion Media and any provider of the data contained in this website will not accept liability for any loss or damage as a result of your trading, or your reliance on the information contained within this website.
It is prohibited to use, store, reproduce, display, modify, transmit or distribute the data contained in this website without the explicit prior written permission of Fusion Media and/or the data provider. All intellectual property rights are reserved by the providers and/or the exchange providing the data contained in this website.
Fusion Media may be compensated by the advertisers that appear on the website, based on your interaction with the advertisements or advertisers.
© 2007-2024 - Fusion Media Limited. All Rights Reserved.