
Originally Published August 1, 2020
Market Overview: Weekend Market Update
The Emini has rallied strongly for 4 months from its 10 year bull trend line. It has paused for a couple weeks in the February gap. Traders are deciding whether the rally will close the gap and continue to a new high, or reverse down and retrace half of the rally. The probability is slightly better for the bulls.
The bond futures market has rallied relentlessly on the weekly chart after a climactic reversal down in March. This increases the chance of a sudden acceleration up.
The EUR/USD Forex chart has had its strongest 3 week rally in 8 years. It is overbought on the daily chart and at the resistance of the September 2018 high. There is a nested wedge buy climax on the daily chart. Traders expect a pullback lasting at least 2 weeks and falling at least 200 pips.
30 year Treasury Bond futures weekly chart:
Weak but persistent rally for 2 months
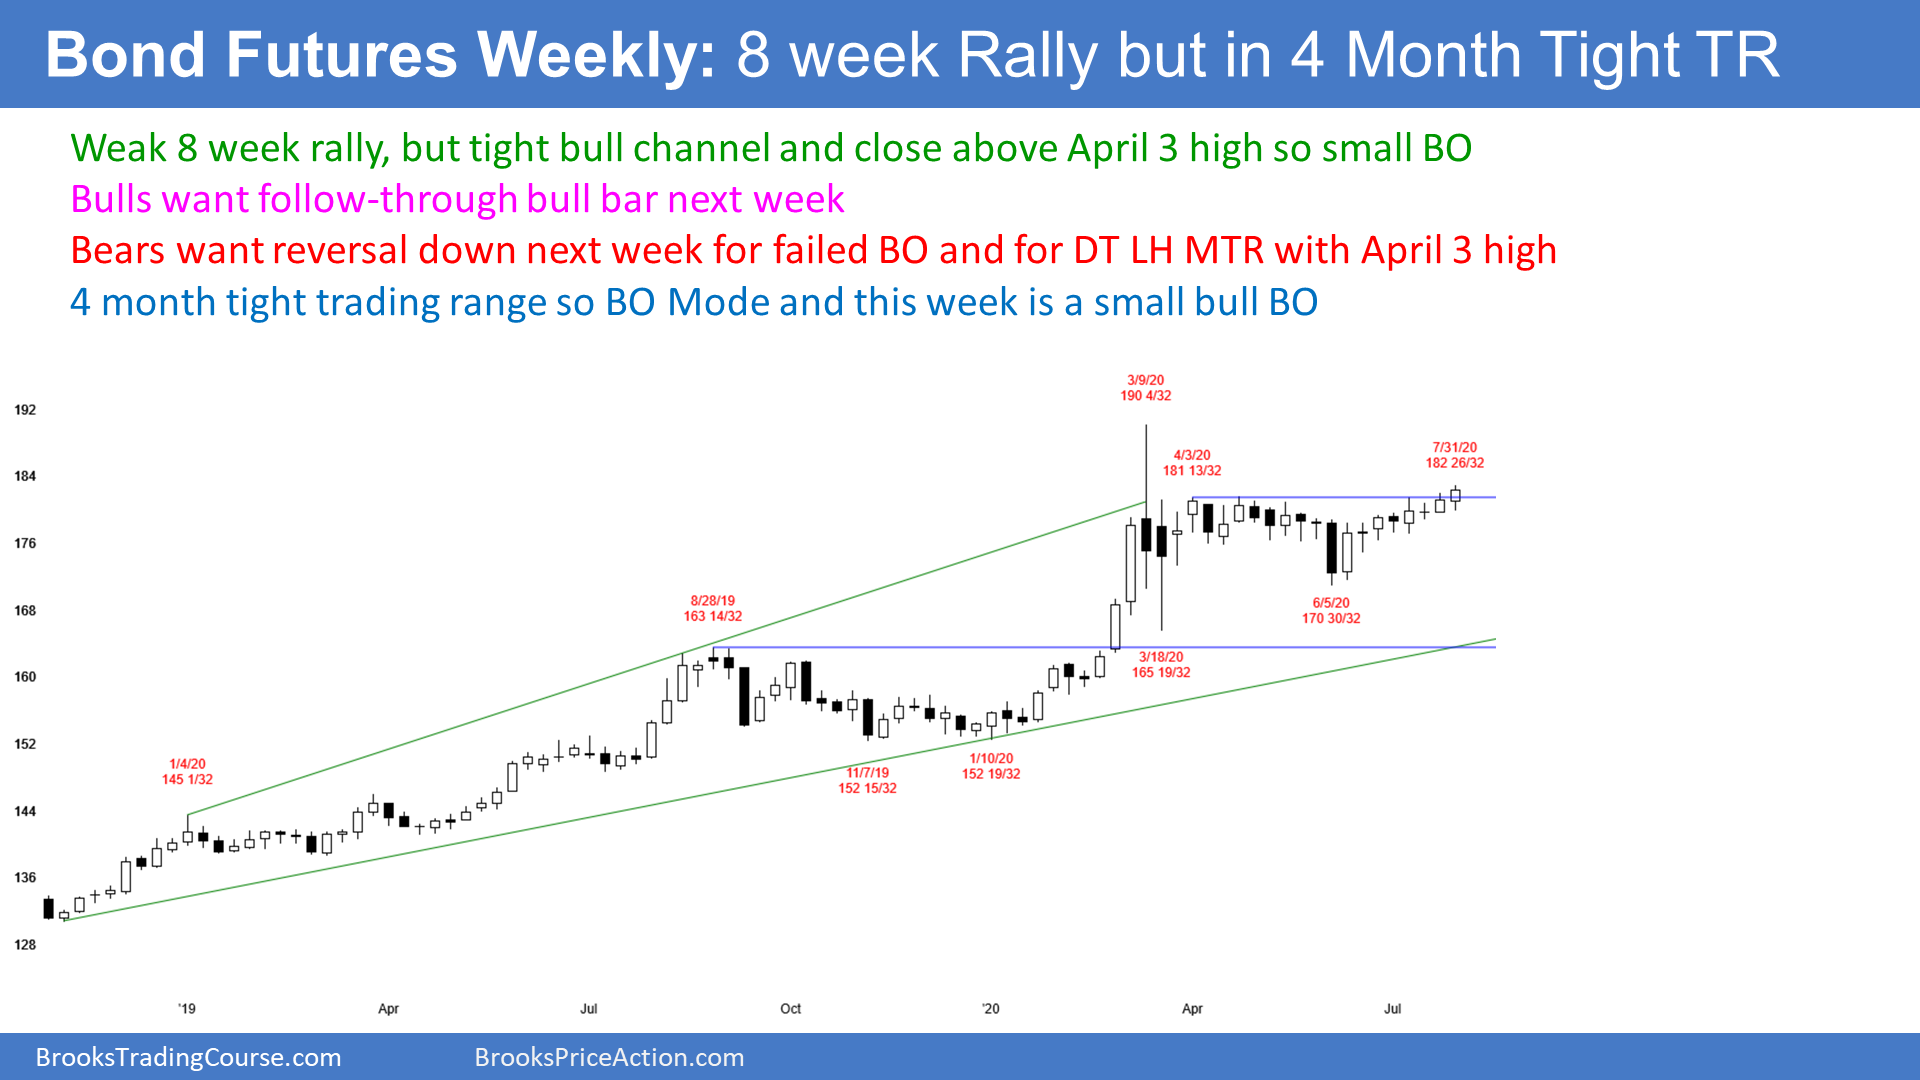
The 30-Year Treasury bond futures market is relentlessly marching up in a 9 week bull micro channel. While the price increase has not been dramatic, the bulls are winning every week on the weekly chart. They keep getting a high above the prior week’s high and a low above the prior week’s low. This makes higher prices likely.
I mentioned last week that a unimpressive bull trend that is relentless often suddenly breaks to the upside. Traders should not be surprised if this were to happen.
I have pointed out several times that the rally from the 2019 low has had 2 legs up and it has been climactic. Climactic rallies tend to have a 3rd leg up before they exhaust themselves. Consequently, even with the dramatic climactic reversal down in March, the bulls still have a 40% chance that the current 2 month rally will make a new high. If it does, traders should expect a reversal down from a 2 year wedge top.
Can the weekly chart reverse down next week? The 1st reversal down from a tight bull channel is typically minor. Therefore, the best the bears can probably get is a minor reversal down. That means a 1 – 2 week pullback. They will likely need at least a micro double top before they can reverse this 9 week rally.
EUR/USD Forex weekly chart:
Strongest 3 week rally in 8 years, but nested wedge buy climax

The EUR/USD Forex weekly chart this week formed its 3rd consecutive big bull bar. This is the strongest 3 week rally on the weekly chart since 2012.
For over a year, I have been saying that the September 2018 high was a magnet and therefore resistance. That was the start of the 2 year bear channel that began after the spike down in early 2018.
When there is a break above a bear channel, the rally usually tests the start of the channel. That is what is happening now with the test of the September 2018 high. The chart then often converts into a trading range.
But with this 3 week rally as strong as it has been, the downside risk is small over the next couple of weeks. The bears will need at least a micro double top before there is more than a 1 – 2 week pullback. A micro double top typically takes at least 2 – 3 bars (weeks) to form. Therefore, the EUR/USD will probably be sideways next week on the weekly chart.
Wedge rally to a double top could lead to a deeper selloff
I said that the 1st reversal down might only last a couple weeks. But if there is then a brief rally back up to test the September 2018 high again, there would be a potential micro double top with this week’s high.
It is important to look at the entire chart. Remember, the 3 legs up from the March low is a wedge rally. That is a type of buy climax. It is testing the important September 2018 high. There is therefore the potential for a big double top.
The 2nd leg up in a double top often is a wedge. That increases the chance of a reversal down. A reversal down from a wedge often has about half as many bars as there were in the wedge. Although the 1st leg down might only be a couple weeks, there is a 40% chance that the EUR/USD will soon begin a 2 month swing down.
If it does, it will probably fall below breakout points. Those are the March 9 and the June 10 highs. It could also drop down to the bottom of the most recent buy climax within a couple months. That is the June 19 low of 1.1168.
Traders will know within a few weeks if the EUR/USD will simply pause and the continue up or begin a test down to the breakout points. As strong as the 3 week rally has been, traders should expect the EUR/USD to be lower a month or two from now.
Next target for the bulls is the 2018 high around 1.25
Can the rally continue up the the 2018 high? It might next year, but the current rally is so extreme that it will attract profit takers within a few weeks. That should result in at least a 1 – 2 week initial pullback of about 200 pips. The pullback will probably start next week. However, after such a strong rally, traders will buy the pullback. But, as I said above, if there is then a 2nd reversal down, the selloff could be deeper and last longer.
The bulls need follow-through buying in August on the EUR/USD monthly chart
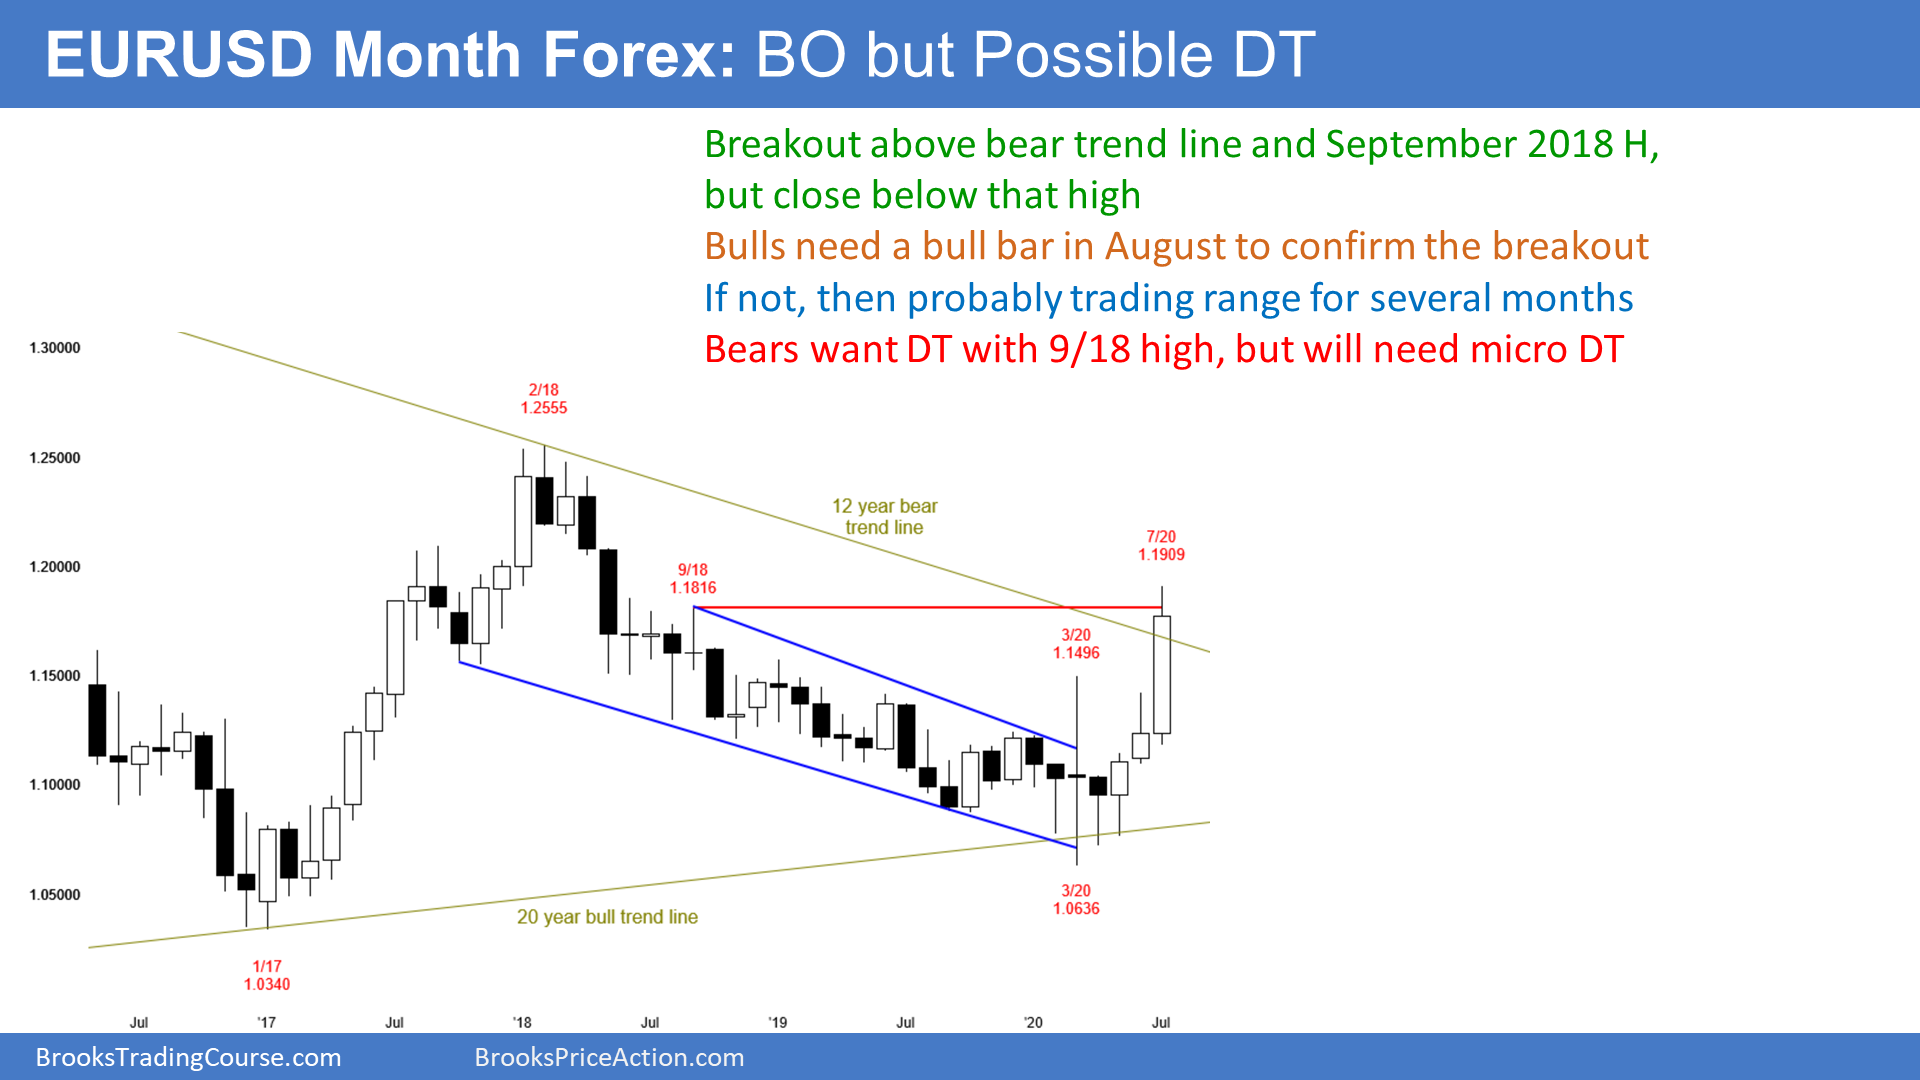
July was a big bull trend bar on the monthly chart. It broke above a 2 year bear channel. When there is a breakout, traders want confirmation. The bulls want August to have a bull body on the monthly chart. If it does, that would increase the chance of higher prices in September.
But if August closes near its low, then September will probably trade below the August low. The monthly chart might then evolve into a trading range for many months. That is what typically happens when there is a breakout above a bear channel.
If August closes somewhere in the middle of its range with either a small bull or bear body, traders will still expect at least slightly higher prices later in the year, but not necessarily in September.
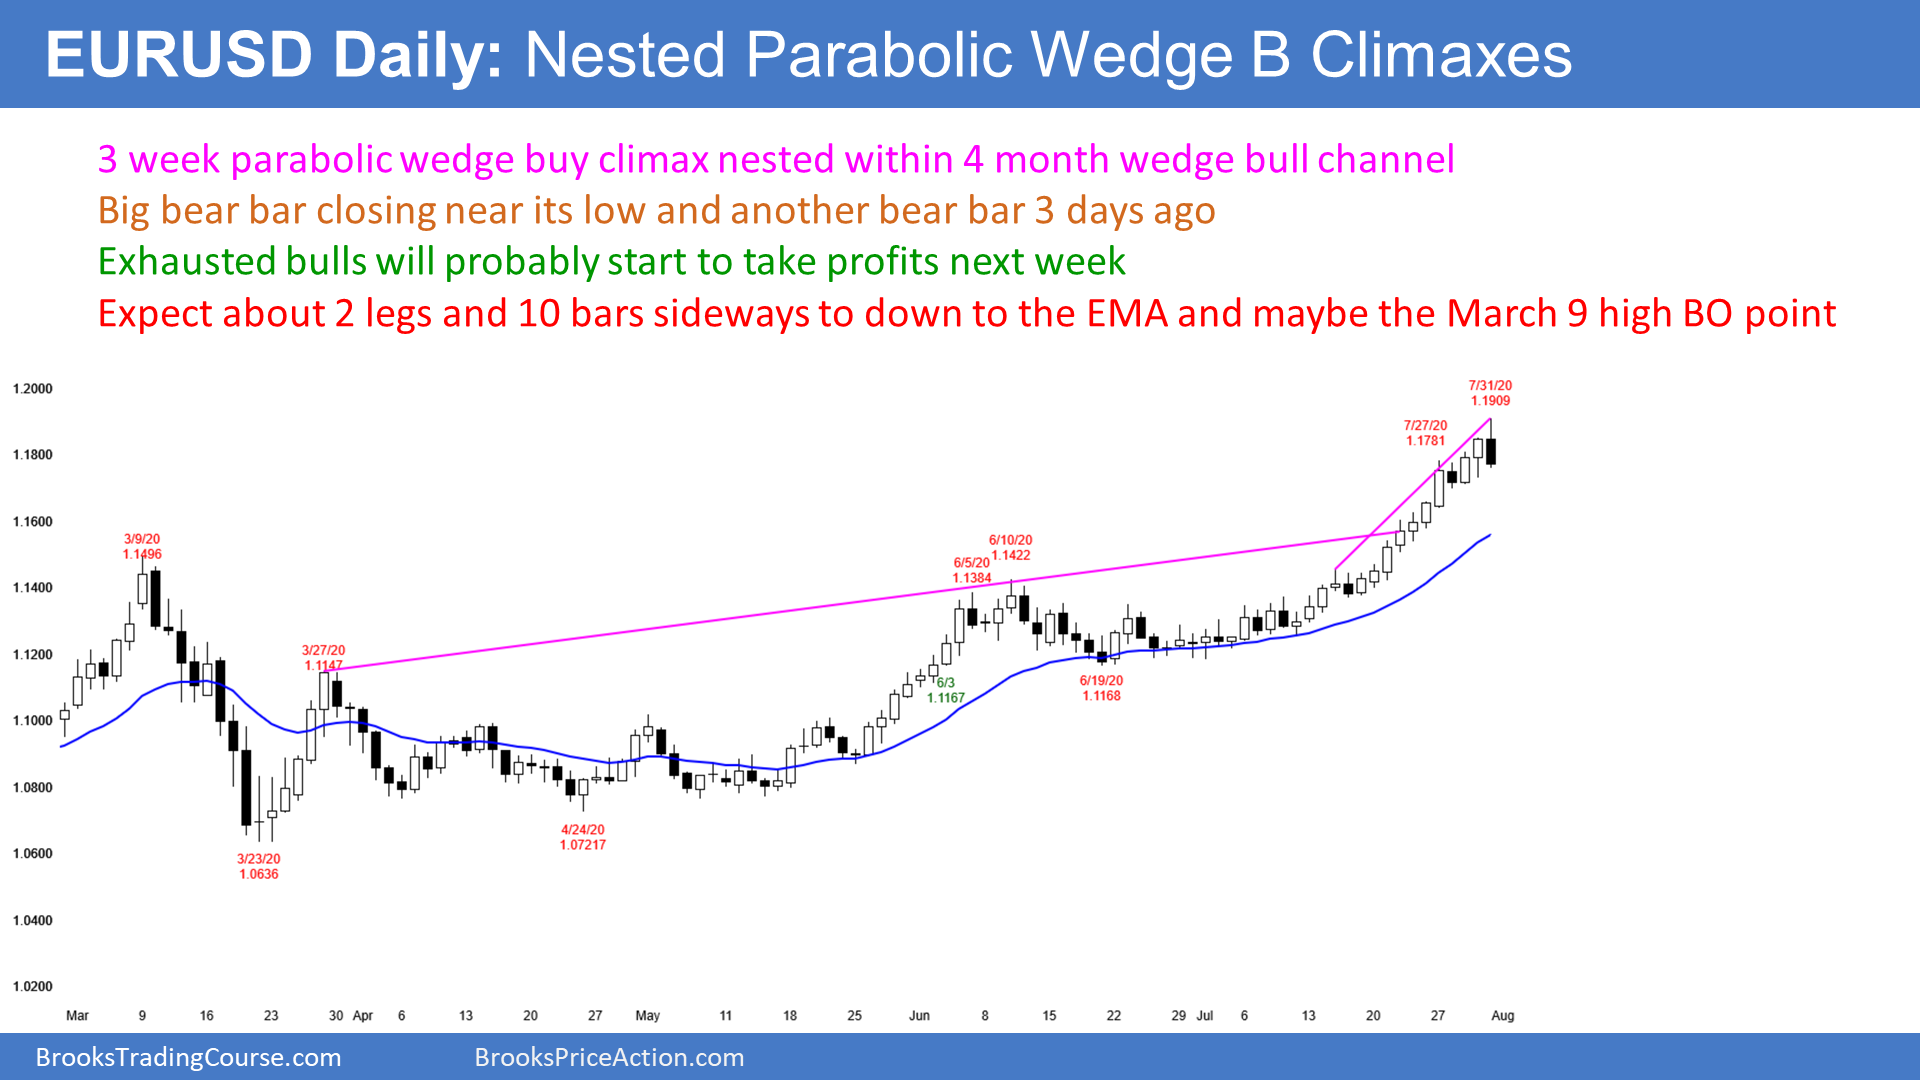
The EUR/USD daily chart has had a climactic rally for several weeks. It has had at least 3 small thrusts up and it is in a tight bull channel. This is a parabolic wedge buy climax.
It is nested within a 4 month wedge bull channel. A nested wedge is more likely to attract profit taking.
Friday was a big bear reversal bar and it closed near its low. It is a sell signal bar for a blow-off top. Also, the bear bar from 3 days ago was a prior attempt to reverse. This current 2nd attempt therefore has a higher probability.
After an exhaustive buy climax, traders expect about 10 bars and 2 legs sideways to down before the bulls will buy aggressively again. A minimum pullback should be at least 2%, which is about 200 pips. It usually gets near the EMA. However, as I said above, the selloff could continue down over a couple months to the March 9 and June 10 highs.
Monthly S&P500 Emini futures chart:
Strong July means at least slightly higher prices in August

The monthly S&P500 Emini futures chart had a huge reversal up from the 10 year bull trend line in March. It has rallied strongly for 4 months, almost completely erasing the pandemic crash.
I mentioned in June that the bodies had been shrinking for 3 months. That was a sign that the rally was losing momentum as it approached the top of the 3 year trading range. Also, June had a big tail on top. That is a sign of the bulls taking profits.
This combination made it likely that July would not get much above the June high. While that turned out to be true, July closed on its high and above the June high. This is a resumption of the momentum up.
That is a low probability outcome. When there is a bull surprise, there is usually at least some follow-through buying. This increases the chance of at least slightly higher prices in August.
Weekly S&P500 Emini futures chart:
4 month island bottom if gap up next week
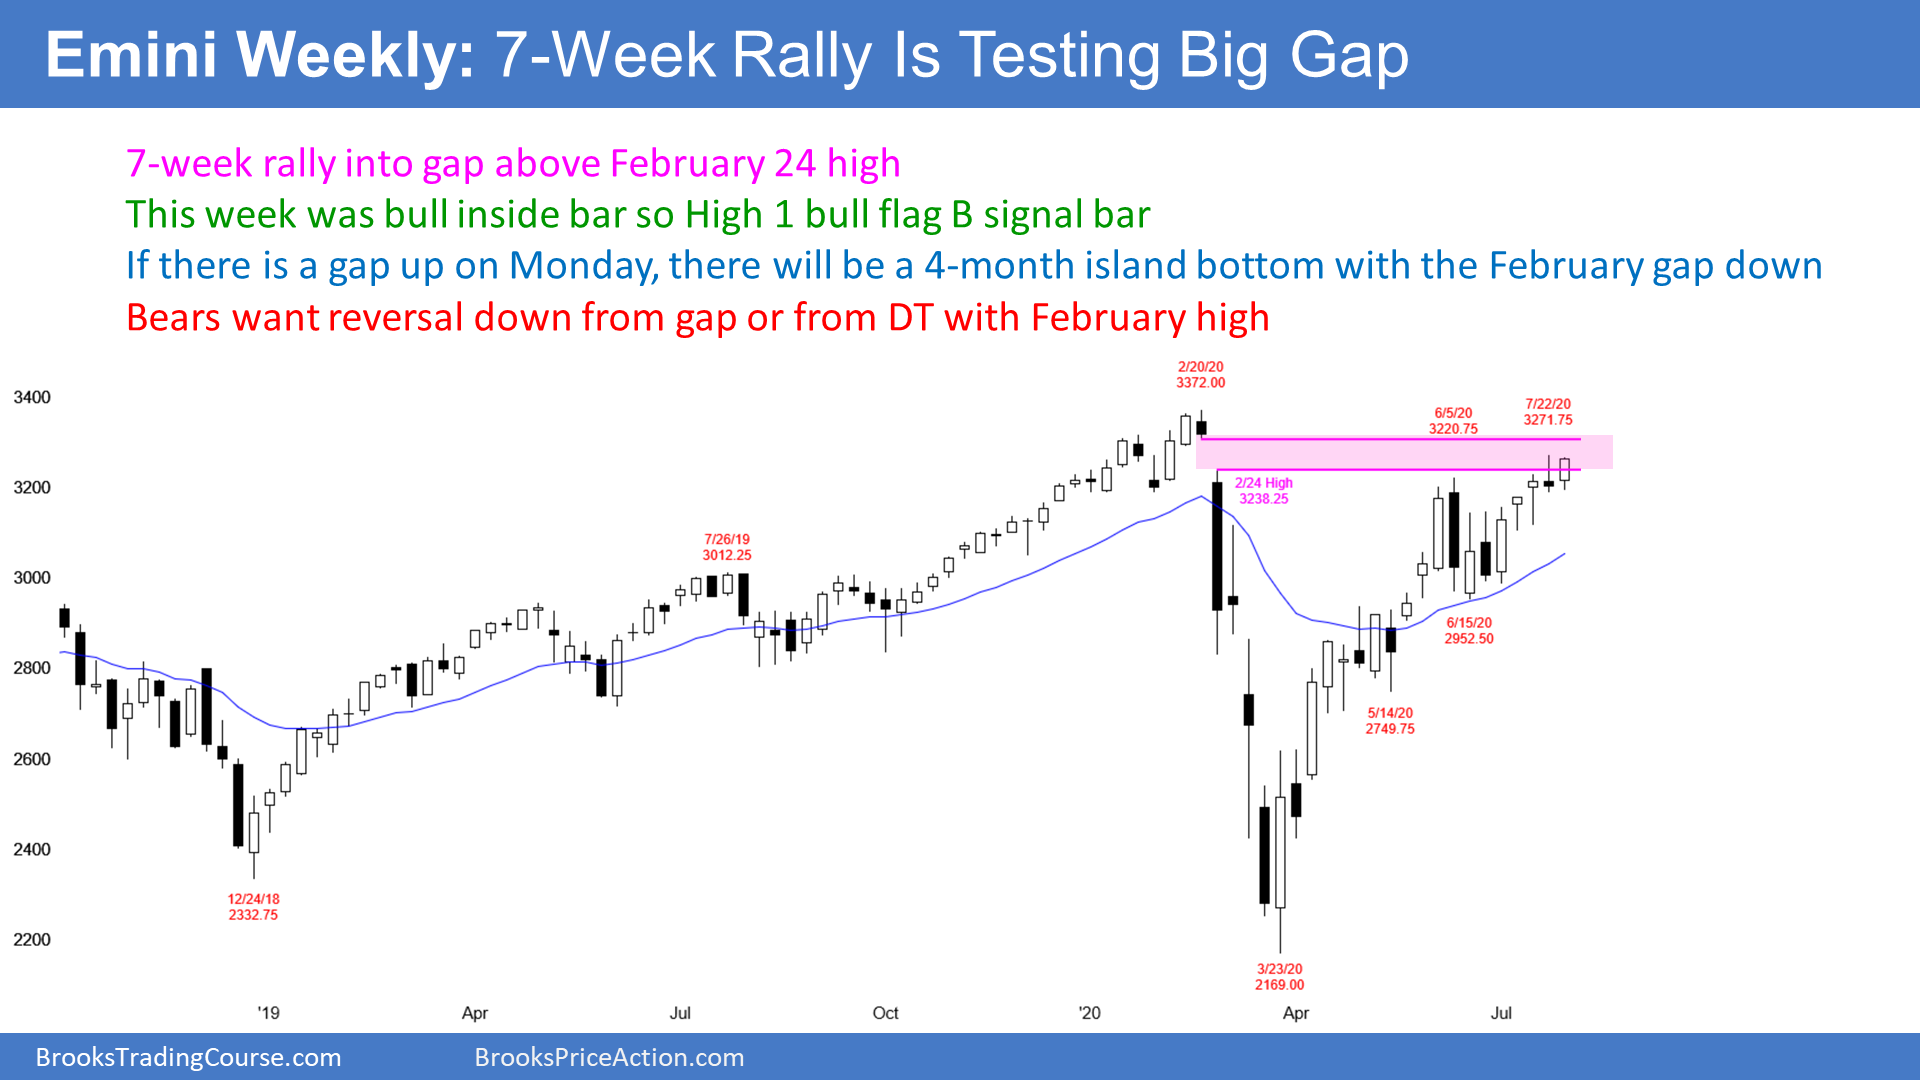
This week closed on its high, which is good for the bulls. It is a bull inside bar in a bull trend. It is therefore a High 1 bull flag buy signal bar for next week. This increases the chance of at least slightly higher prices next week.
The bulls want the Emini to trigger the buy signal next week by going above this week’s high. They then want the rally to close the February gap. Since the top of the gap is just below the all-time high, if they close the gap, the will probably get a new all-time high soon afterwards.
Possible 4 month island bottom
Two of the past 4 weeks gapped up, but both gaps closed later in the day. With this week closing on its high, there is an increased chance of a gap up next week.
Since the Emini gapped down 4 months ago, a gap up would create a 4 month island bottom. If the gap is big, the odds of it staying open for at least a few weeks will go up. It would also increase the chance of a new all-time high within a few weeks.
Because the March crash was so severe, there are many traders shorting around the old high. A rally to a new high could create intense short covering. This could result in a surprisingly big breakout.
Persistent rally but some weakness
The weekly S&P500 Emini futures chart has rallied in a Small Pullback Bull Trend since the March low. However, the 5th week up was a doji bar. Also, there have been several other dojis and bear bars since.
This is trading range price action. That increases the chance that the rally since that doji bar in April is only a bull leg in what will become a trading range.
There is no top yet and the momentum up at this point is strong enough so that traders think that a new high will come before there is pullback lasting more than a few days.
It is important to note that even though the week closed on its high, it did not go above last week’s high. Also, the 3 prior weeks had small bodies and big tails. Every tail is a reversal. These doji bars are a sign of balance and uncertainty. This gives the bears hope of a reversal down before there is a new high.
The Emini in the weekly chart has paused for 2 weeks in the February gap. Traders do not yet know if there will be enough sellers here to get a 1 – 2 month reversal down to the middle of the 3 year trading range. That is also the middle of the 4 month rally. They should find out within a couple weeks. At this point, the odds slightly favor a new high before a pullback.
When will the bull trend end?
As I said, there is no top yet and the Emini might rally to a new all-time high before there is a bear leg. However, a rally with lots of trading range price action typically eventually evolves into a trading range.
A conversion into a trading range would require a selloff lasting at least a few weeks. If it were to begin around the old high, the 1st downside target would be the 5 week trading range that ended in early July. That is a potential Final Bull Flag.
It is important to understand that the bear leg often falls all of the way down to that 1st doji where the trading range price action began. That is the April 21 low just above 2700.
Daily S&P500 Emini futures chart:
Sideways for 2 weeks in February gap
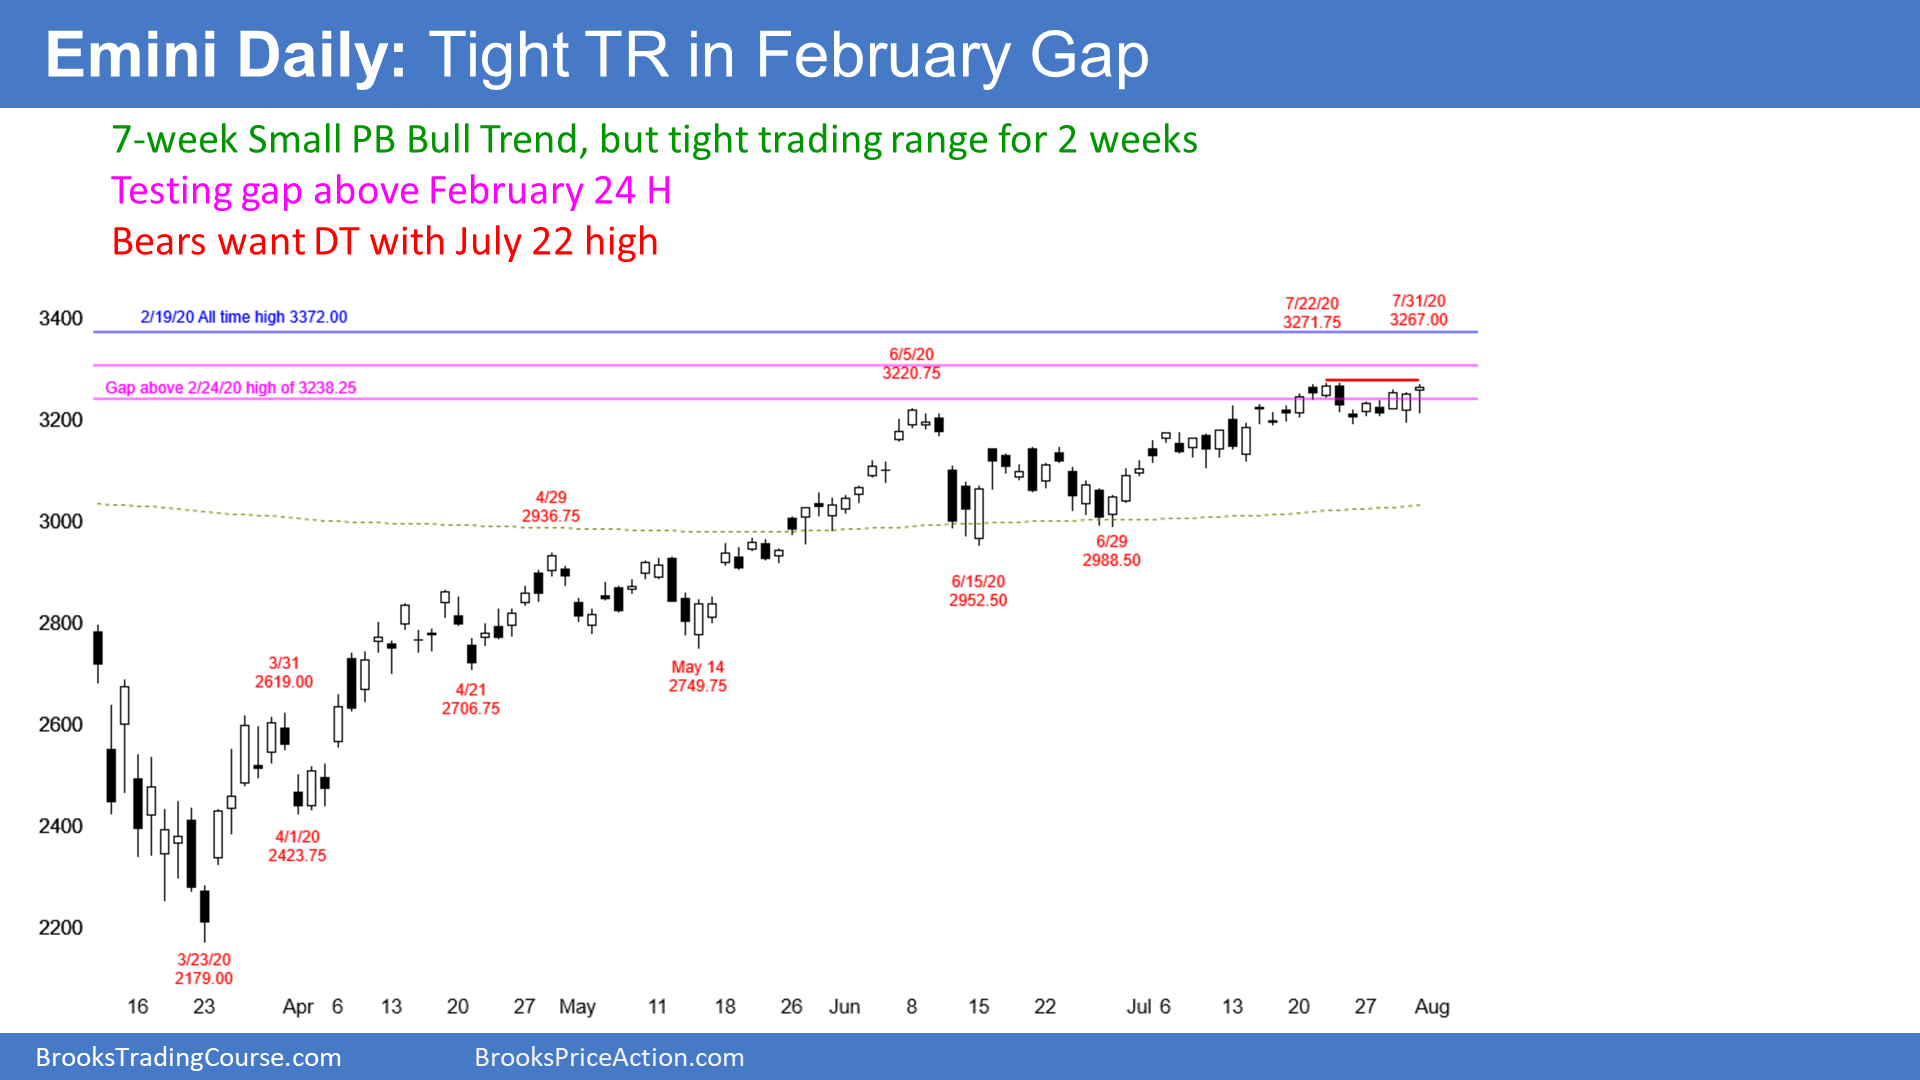
The daily S&P500 Emini futures chart has had many big days up and down in July. It continues to oscillate in a tight range around the February 24 high. That is the bottom of the gap down on the daily and weekly charts at the start of the pandemic crash.
I have talked about that gap as an important magnet since it formed. Once the rally started to get near it in June, I said that traders would expect the Emini to enter the gap. I said most bears would not want to sell unless the Emini entered the gap and reversed down. It has entered the gap, but there has not yet been a credible top.
The Emini is testing the February gap and the all-time high. This is a very important price level. The past 3 days each had bull bodies and closed on its high. It is in a bull trend on the daily and weekly charts. On the monthly chart, July closed on its high and well above the June high. These factors make it more likely that the bulls will get their new all-time high in August before there is more than a 3 day pullback.
Potential for surprisingly big breakout up or down
The Emini is now back at the start of the Pandemic Crash. This is an emotional level.
Energy is building within the February gap. This increases the chance that one side or the other will get trapped. That can result in a very big breakout with sustained follow-through, and the move can be in either direction. We just don’t know at this point if the breakout will be up or down, and if the losing side will exit in a panic, creating a huge breakout.
The bulls got trapped by the crash in February and March. Many are afraid that there might be another selloff at this level. This could result in panic selling.
Yes, the bulls have momentum, but have you heard anyone say that people should sell here? This means that the longs are in a crowded trade. There might not be a lot of shorts to cover. We don’t know. But if the shorts won’t buy and the bulls are fully invested, who will buy at this price? This creates the potential for a big move down.
Also, there might be many bears selling here, betting on a double top. If so, they will get squeezed on a breakout to a new high. A short squeeze can lead to a big rally.
Downside targets
If there is a reversal down, it will probably retrace a third to a half of the 4 month rally. Big round numbers are important. The most significant ones here are 3000, 2800, and 2700. The reason why 3000 is important is that it is a multiple of 1,000 and not just 100. There is a potential Final Bull Flag around 2800. Finally, 2700 is approximately a 50% pullback of the 4 month rally.