
The S&P 500 is crawling along its 200 day moving average. As a result, some investors and traders are wondering if this will be the first decisive breakdown below the 200 dma for the first time in almost 3 years.
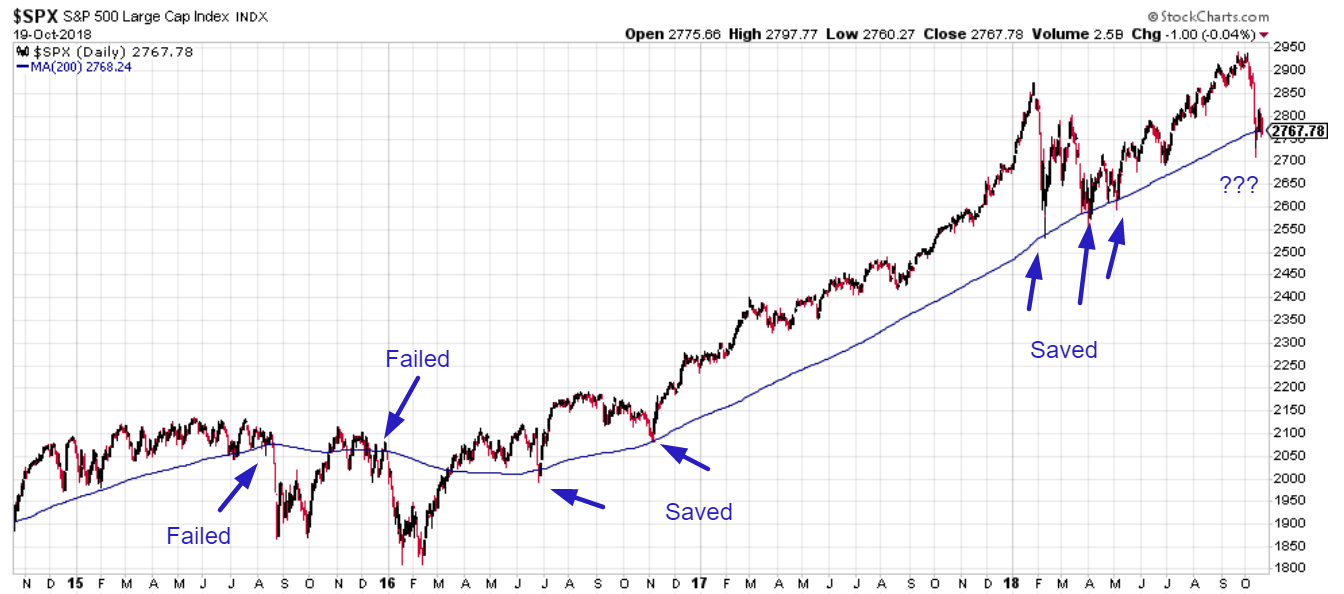
Source: StockCharts
Here’s our long term, medium term, and short term outlook for the U.S. stock market. We focus on the long term and medium term. As U.S. stock market investors and traders, our job is to separate the signal from the noise.
As always, the economy’s fundamentals determine the stock market’s medium-long term outlook. Technicals determine the stock market’s short-medium term outlook (we quantify technical analysis). Here’s why:
- The stock market’s long term is bullish.
- The stock market’s medium term is bullish.
- The stock market will probably retest the crash’s low or make a marginal new low in the short term.
Focus on the medium-long term. Let’s go from the long term, to the medium term, to the short term.
Long Term
The Medium-Long Term Model will probably predict a “bear market is coming” sometime in mid-2019. Hence, our Long Term Outlook is:
- This is still a bull market.
- The bull market doesn’t have a lot of room left. Probably less than 1 more year.
Leading economic indicators continue to improve, which is long term bullish for the U.S. stock market & economy.
The Conference Board’s Leading Economic Indicator continues to make new highs. In the past, this leading indicator trended downwards before bear markets and economic recessions began.
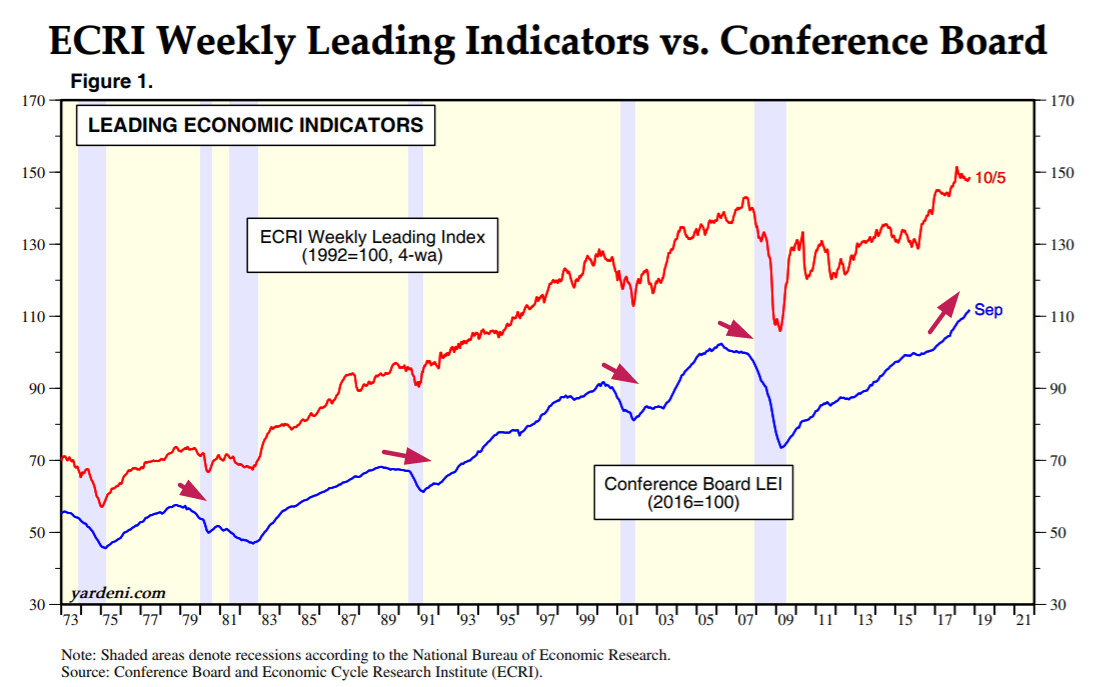
Source: Ed Yardeni
Meanwhile, the Kansas City Fed’s Labor Market Conditions Index is still strong. The Labor Market Conditions Index fell to zero before the last 2 bear markets started.
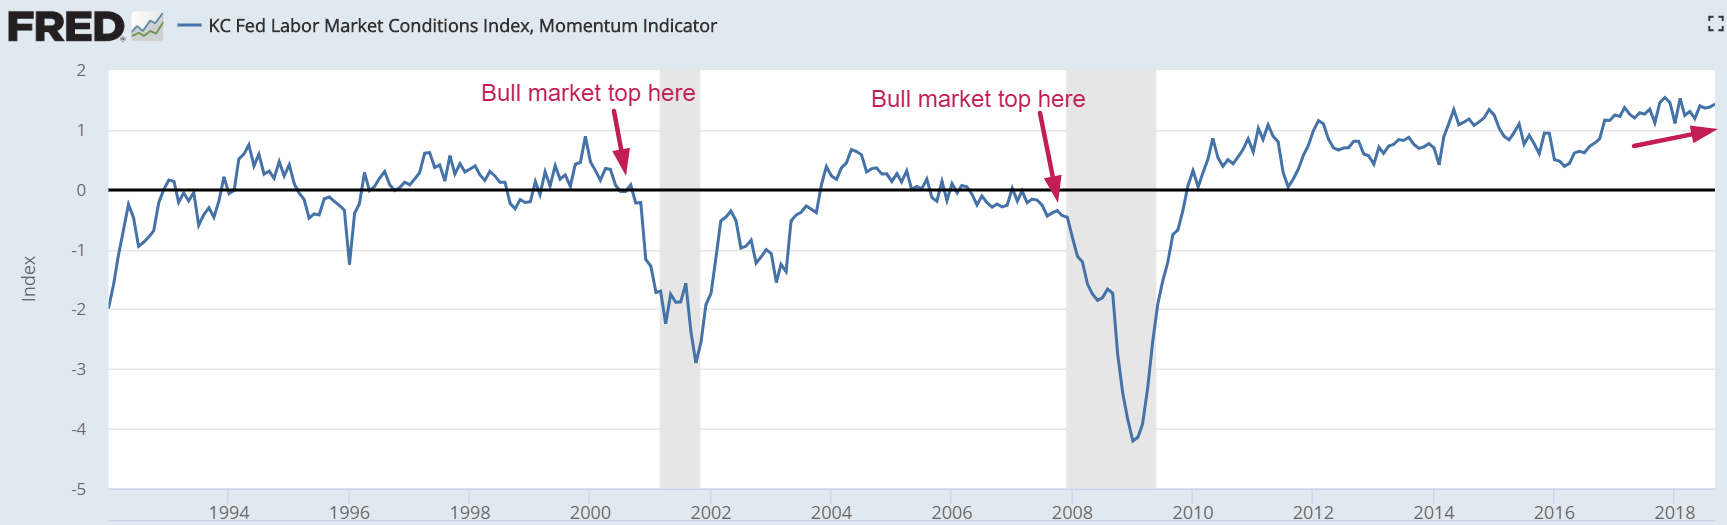
Source: FRED
The strength in U.S. labor markets is clear. Continued Claims just made a new low for this economic expansion. Historically, Continued Claims and Initial Claims trended higher before bear markets and recessions began.
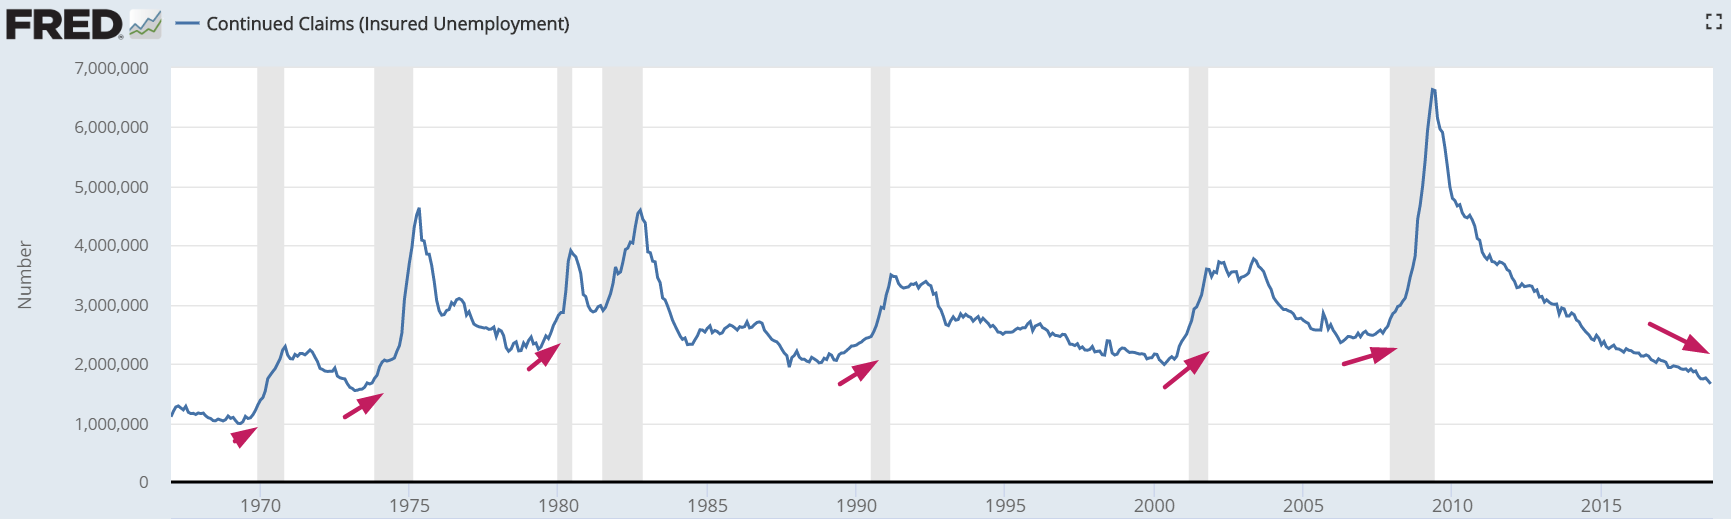
Source: FRED
*With Initial Claims and Continued Claims so low, this bull market probably doesn’t have a lot of time left.
In addition, Delinquency Rates across all loans are falling.
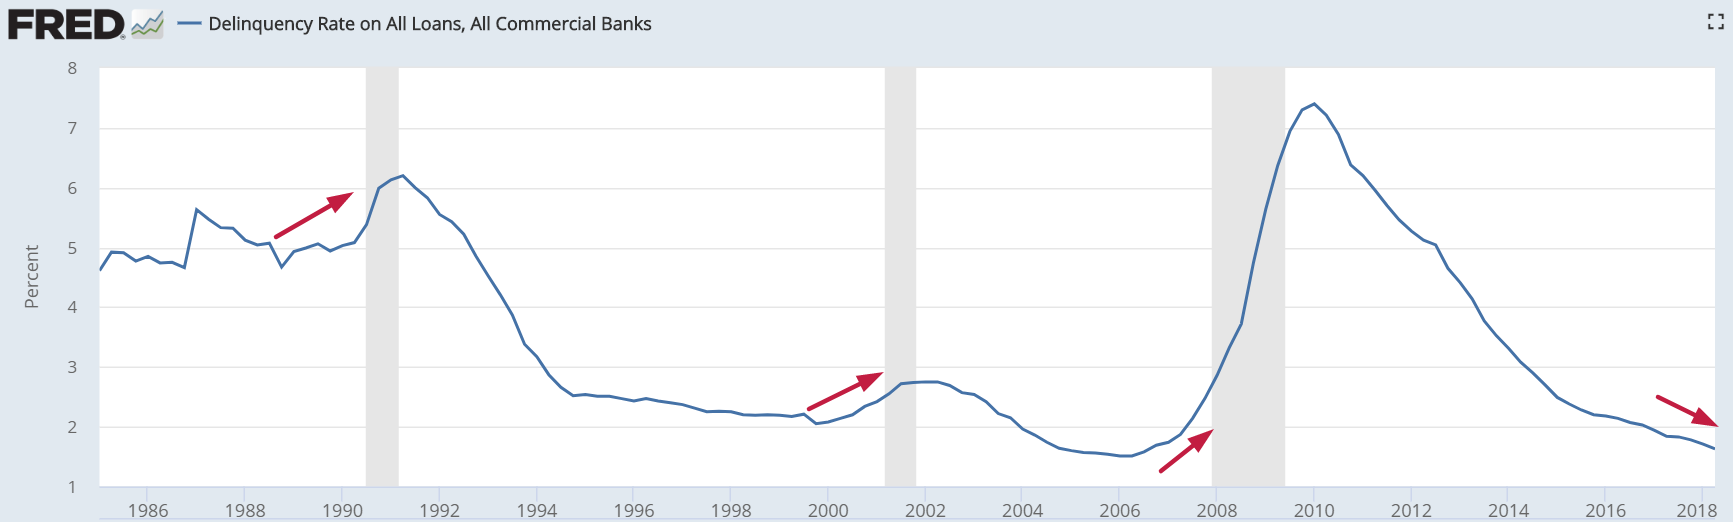
Source: FRED
This is a medium-long term bullish sign for the stock market and economy. As you can see in the chart below, Delinquency Rates tend to trend higher before equity bear markets and economic recessions begin.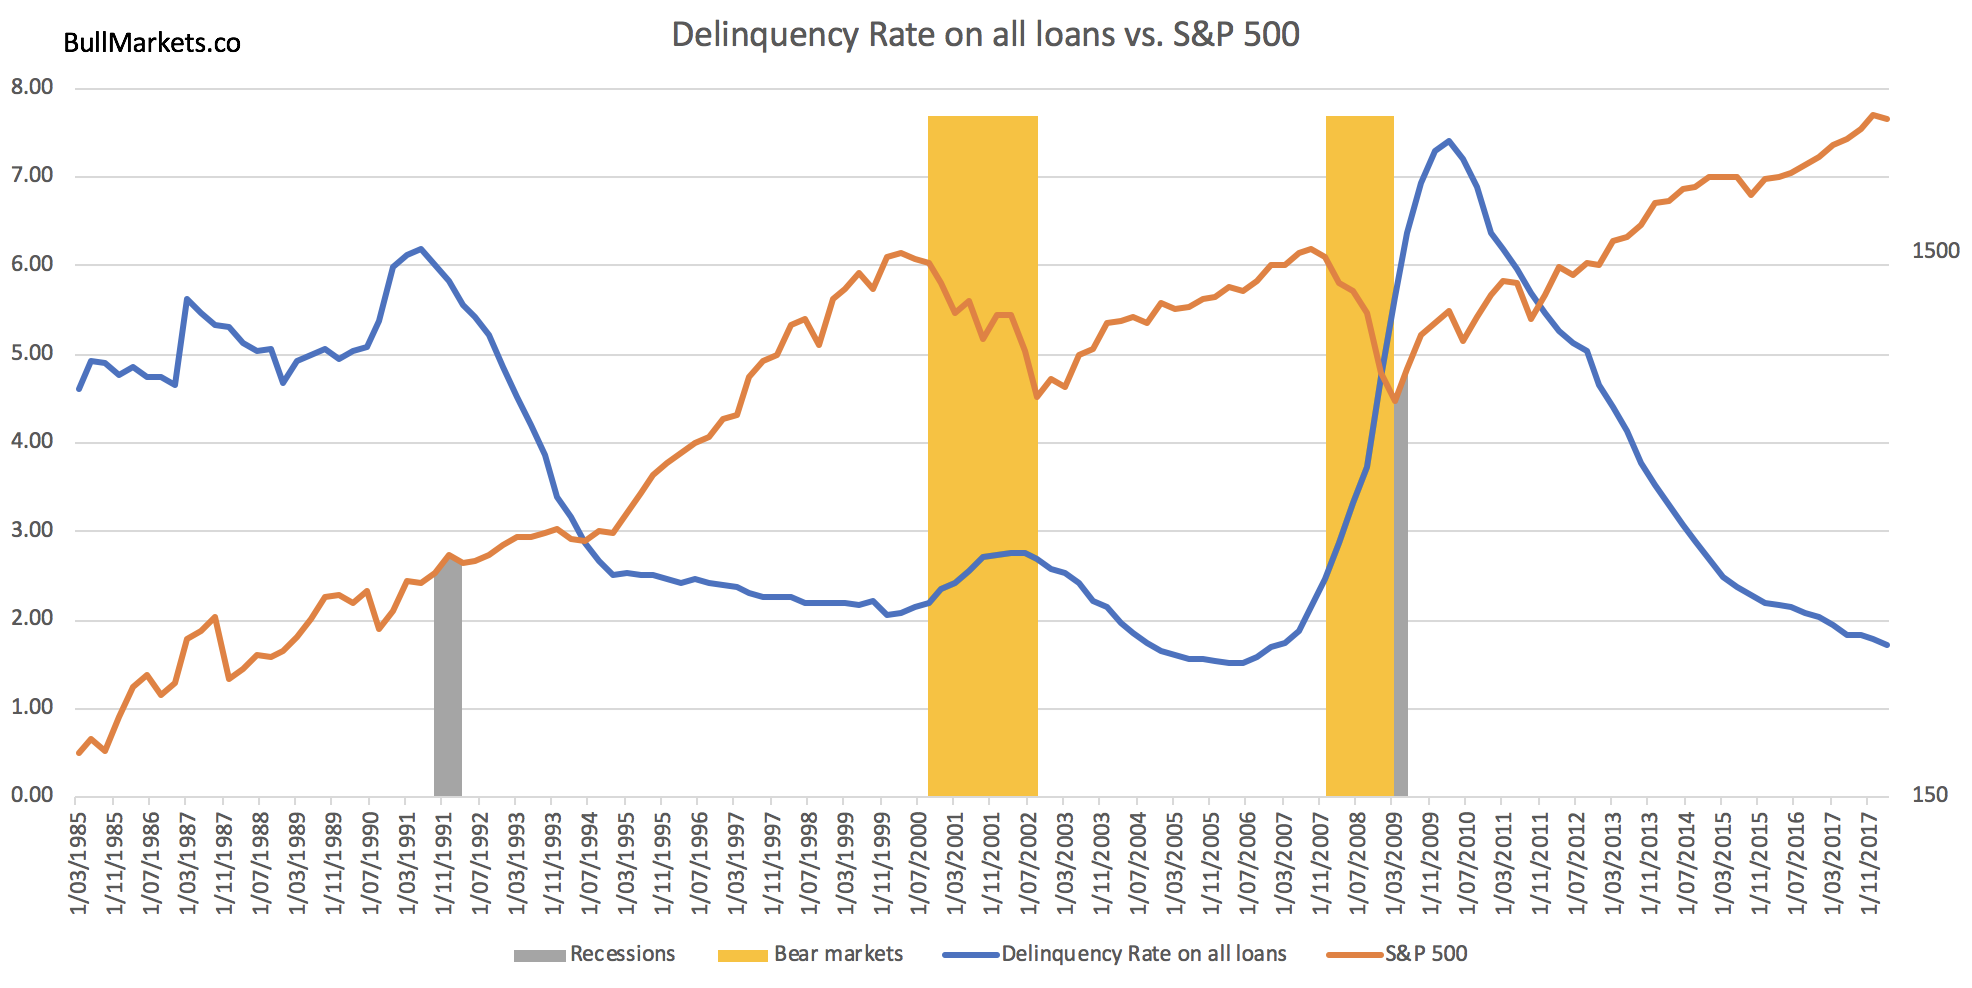
Inflation-adjusted retail sales are still trending higher.
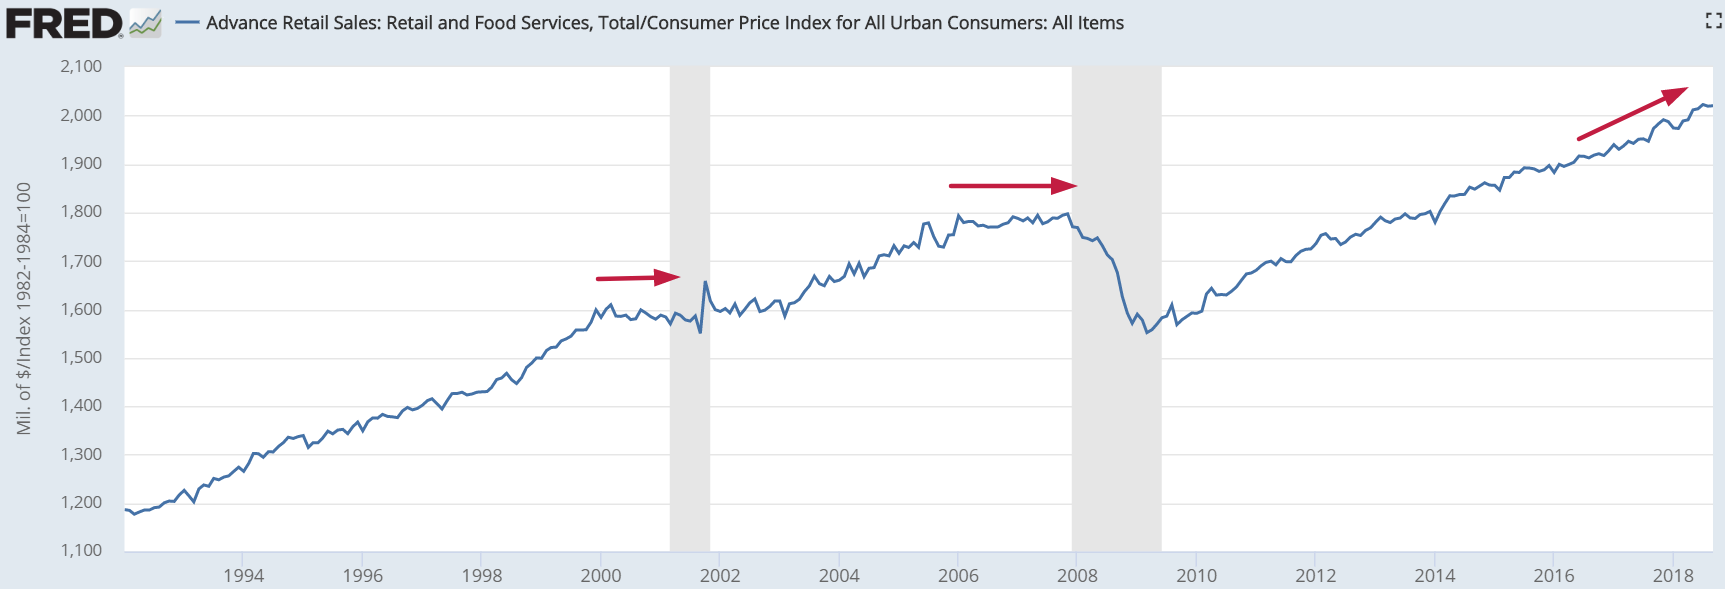
Source: FRED
This is a medium-long term bullish sign for the stock market because inflation-adjusted Retail Sales typically trend sideways before an equities bear market or economic recession begins. This chart demonstrates the positive correlation between the S&P 500 and Retail Sales.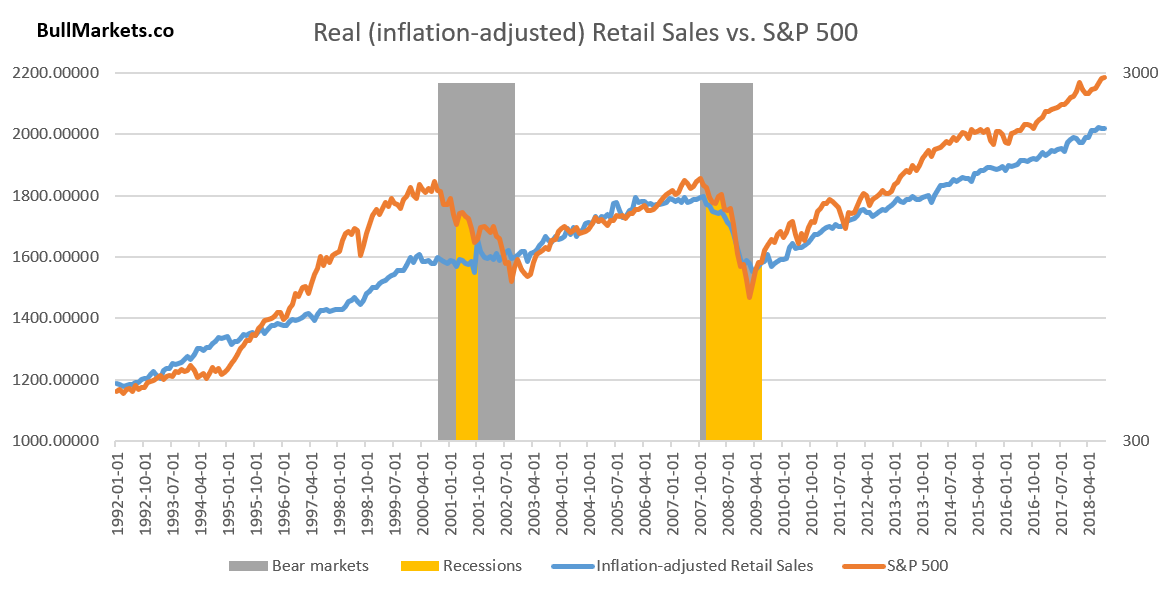
Meanwhile, we’re starting to see initial signs of economic deterioration in the U.S., mostly in the housing market. The usual chain of events looks like this:
- Housing – the earliest leading indicators – starts to deteriorate. Meanwhile, the U.S. stock market is still in a bull market while the rest of the U.S. economy improves.
- The labor market starts to deteriorate. Meanwhile, the U.S. stock market is still in a bull market.
- The labor market deteriorates some more, while other economic indicators start to deteriorate. The stock market tops, and the bull market is over.
We’re now in Step 1.
Housing Starts is no longer trending upwards, but has yet to significantly trend downwards.
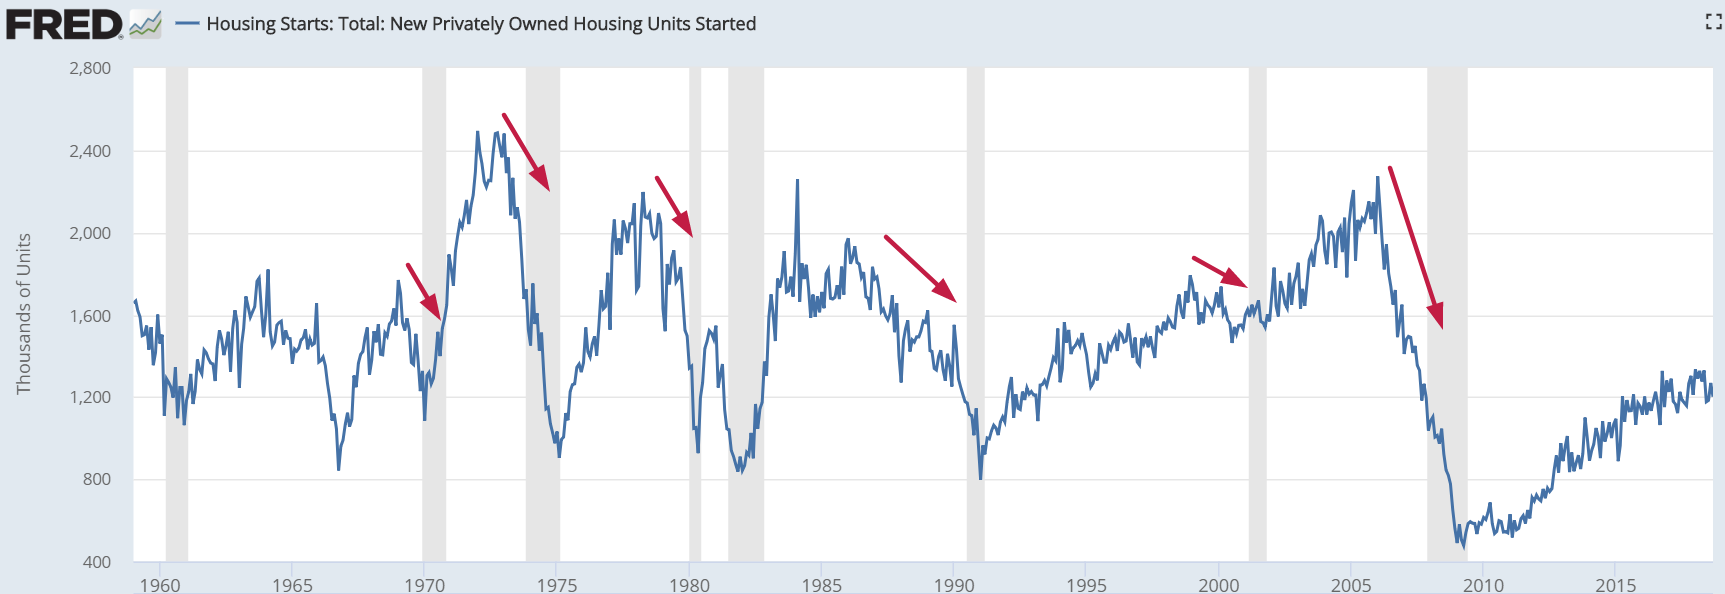
Source: FRED
Meanwhile, Building Permits is trending downwards.
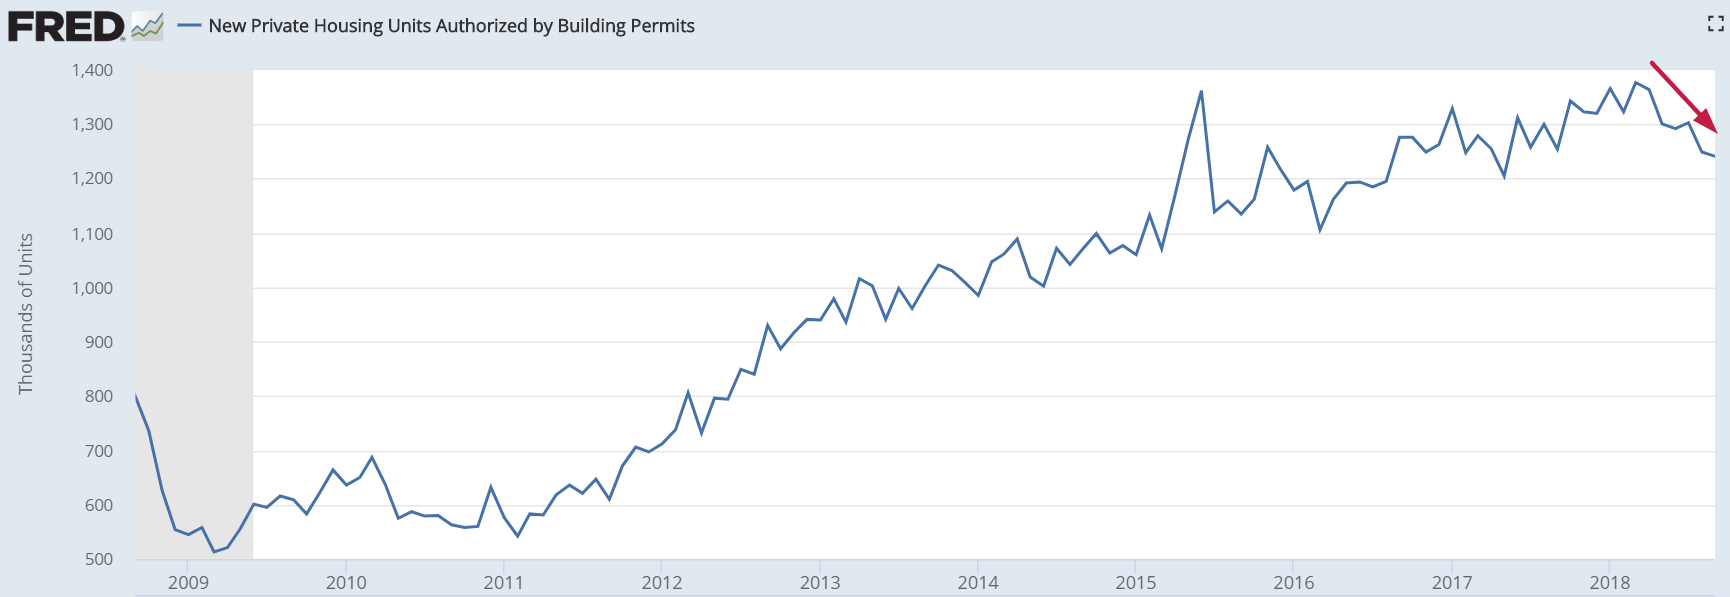
Source: FRED
The deterioration isn’t significant, but bulls should watch out if it continues for a few more months.
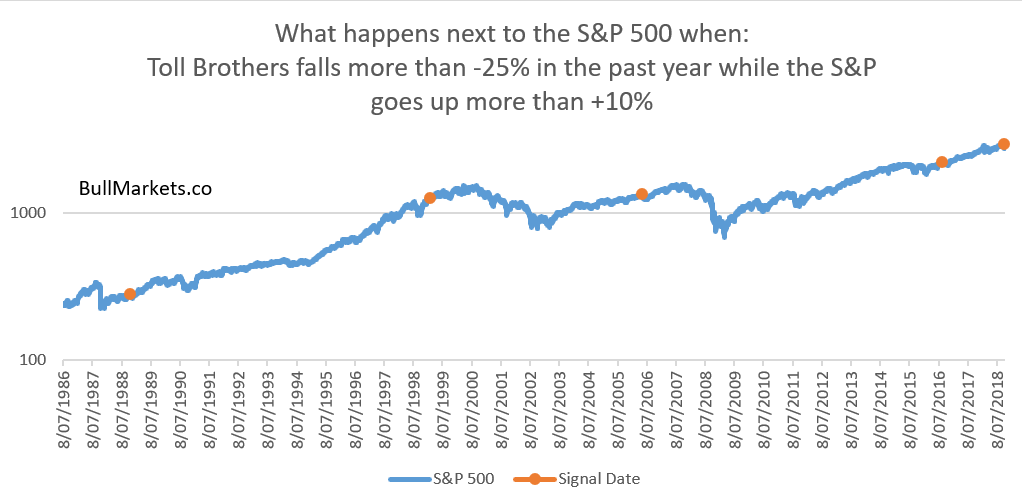
As a result of the recent weakness in housing, housing stocks have been falling significantly. Historically, these divergences between housing stocks like Toll Brothers and the S&P 500 tend to happen 1-1.5 years before a bear market or economic recession begins.
Medium term: Even in a worst case scenario, the stock market will probably still bounce in the next 3 months
*For reference, here’s the random probability of the stock market going higher on any given day.
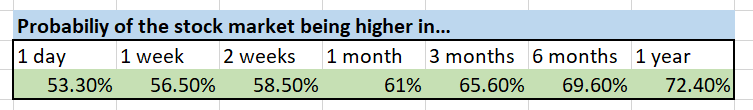
The U.S. stock market’s medium term risk:reward is bullish. Even in a worst case scenario (i.e. this is the start of a bear market), the stock market will probably still bounce in the next 3 months. Bear markets don’t go down in a straight line.
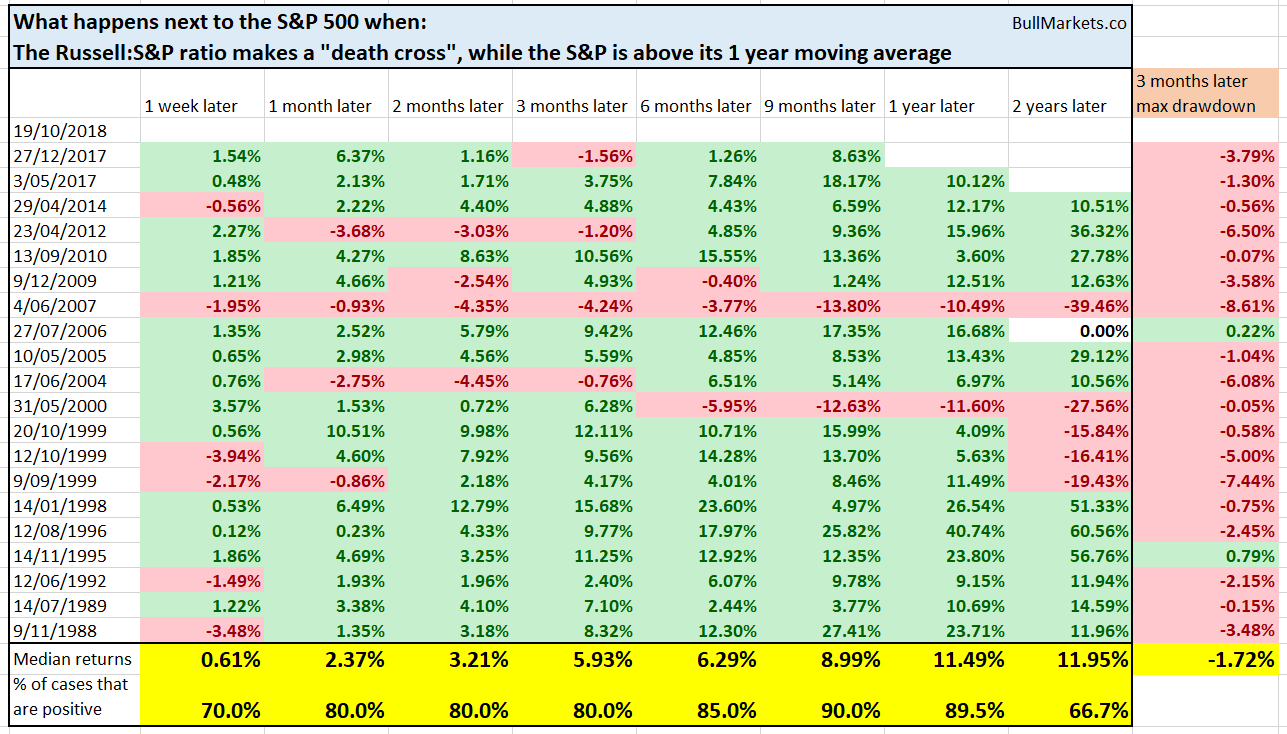
The Russell:S&P ratio (small caps vs. large caps) made a “death cross” last Friday. A death cross is when the 50 day moving average falls below the 200 day moving average.
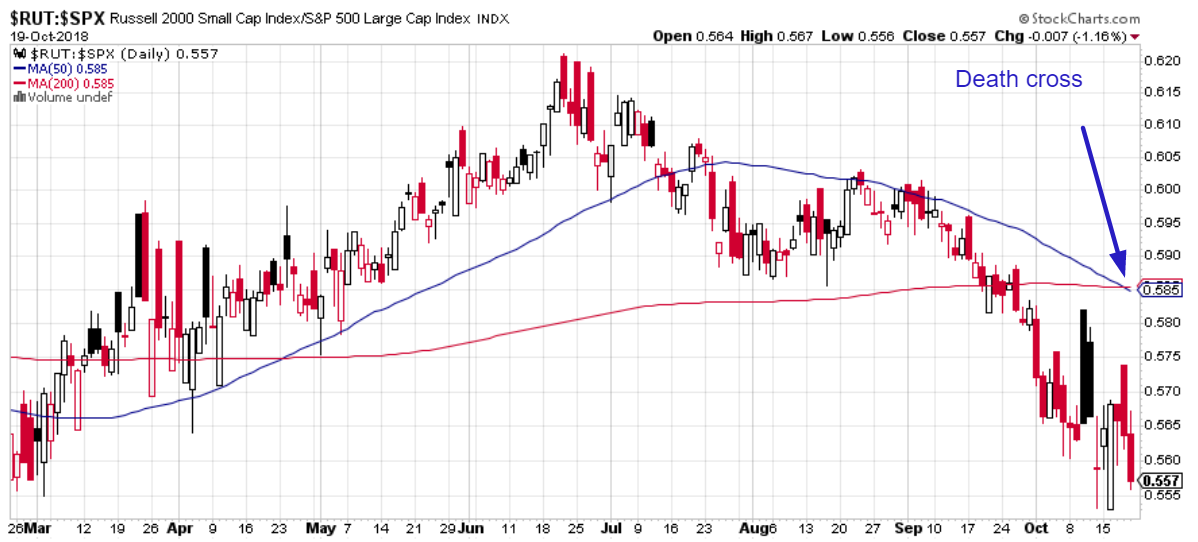
Traders commonly see death crosses as bearish signs. On the contrary, death crosses for the Russell:S&P ratio are a bullish sign!
- 1-3 months later, the S&P is up 80% of the time.
- 9 months later, the S&P is up 90% of the time.
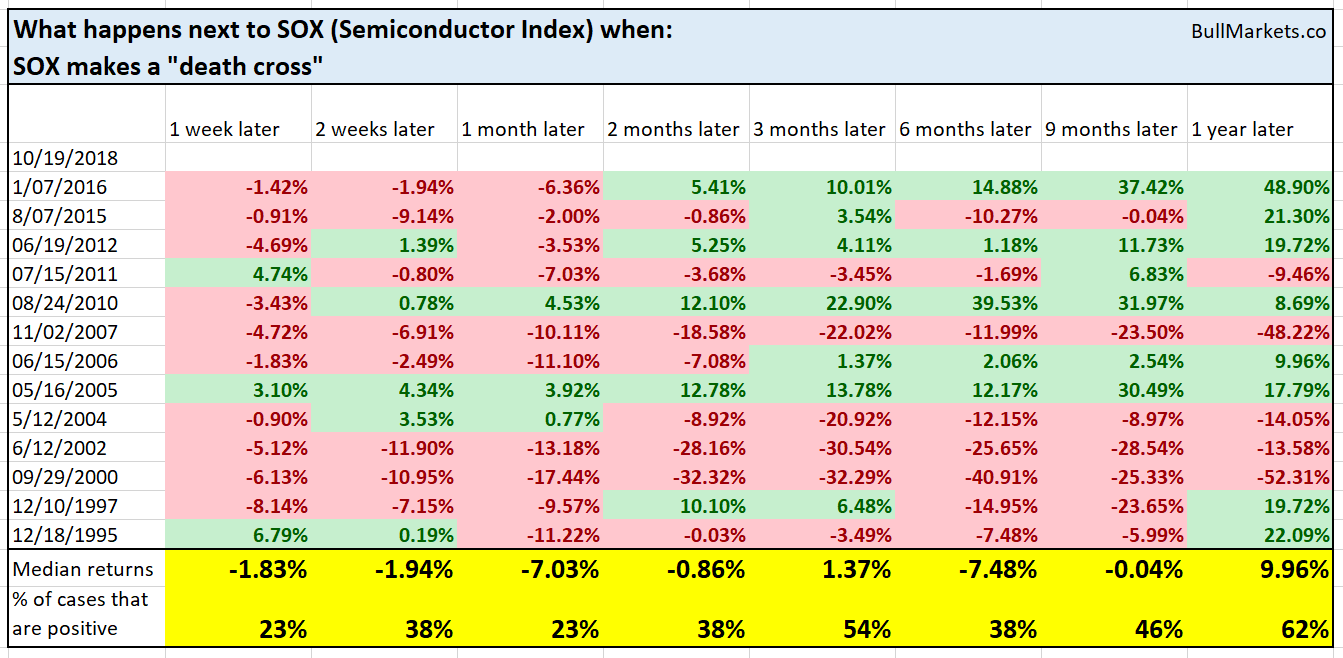
However, not all death crosses are created equal. Philadelphia Semiconductor Index (semiconductors sector) just made a death cross. Historically, semiconductors fell some more in the next 1-2 months. This demonstrates that picking sectors is very hard. From time to time, various sectors can move in opposite directions vs. the broad index.
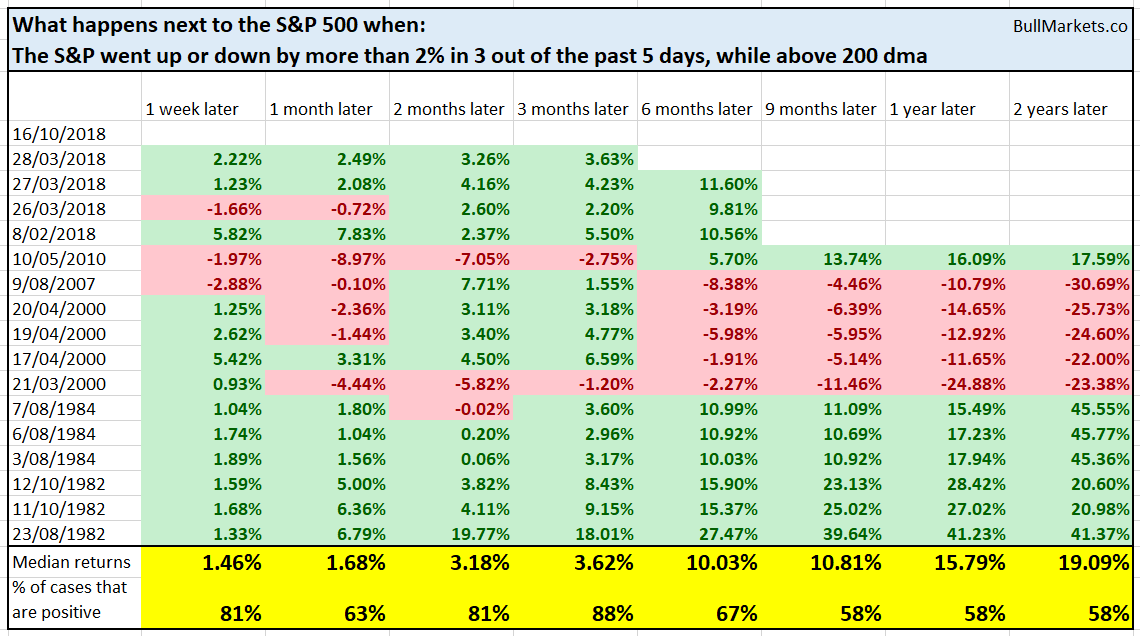
The U.S. stock market’s volatility has been intense over the past 2 weeks. As of last Wednesday, the S&P has gone up or down more than 2% in 3 out of the past 5 days, while above its 200 dma (on the last day).
Historically this meant that:
- The stock market was either near a long term bottom or near a long term top.
- Even in the worst case scenario (stock market near a long term top), the stock market was fine over the next 3 months. (see 2000 and 2007 historical cases)
Likewise, VIX (volatility index) remains elevated. VIX is above its upper Bollinger Band for the 2nd week in a row.
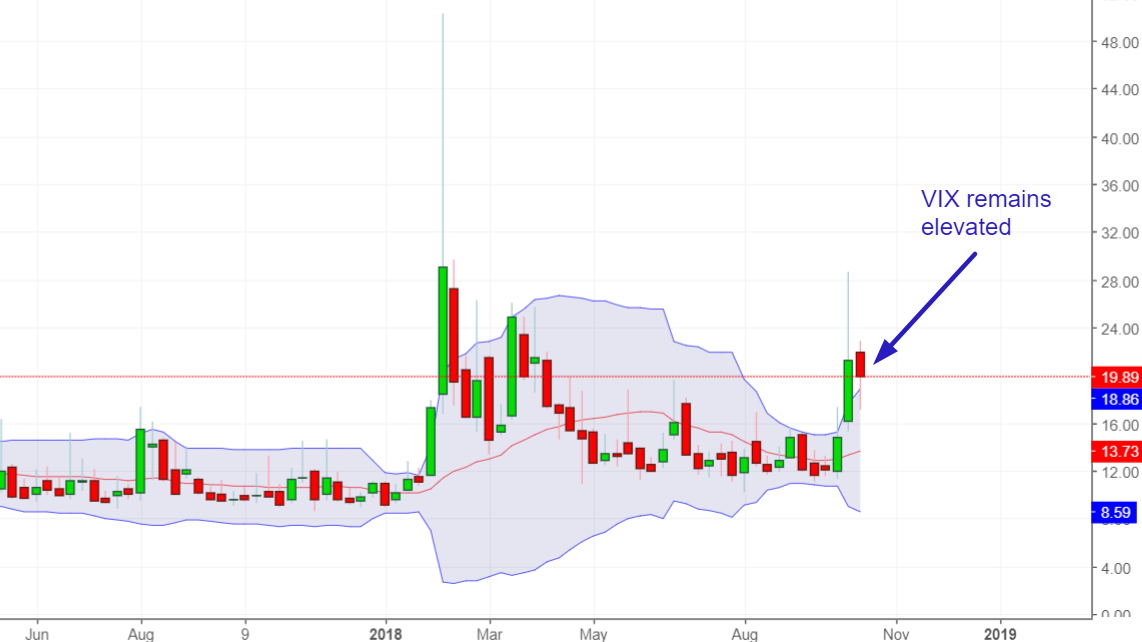
Source: Investing.com
Historically, this meant that VIX would mean-revert downwards over the next 3 months while the S&P 500 went up.
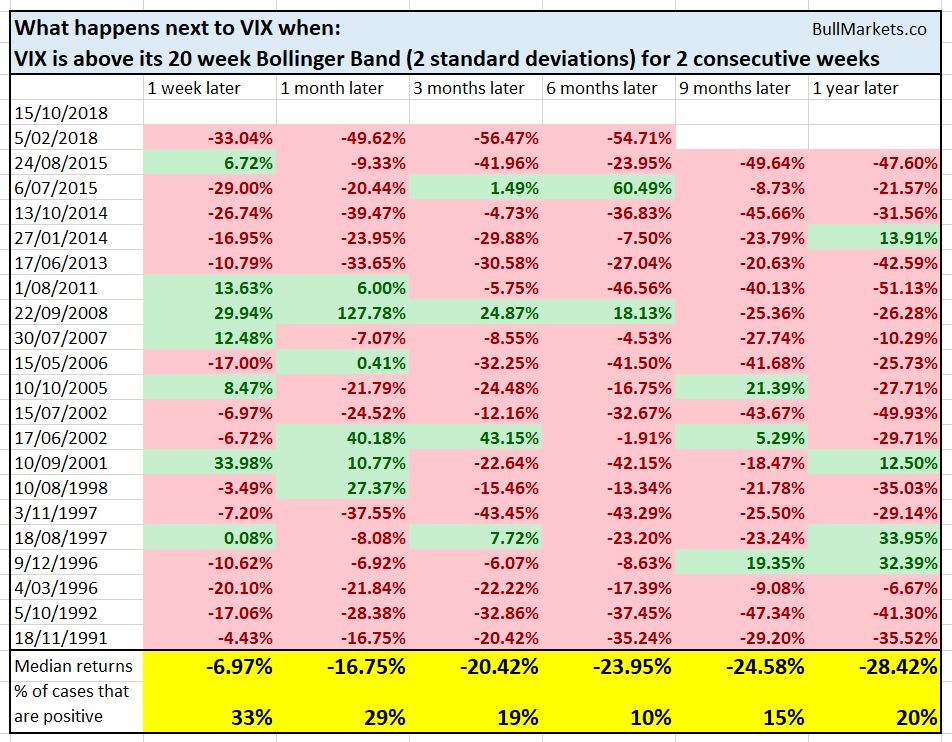
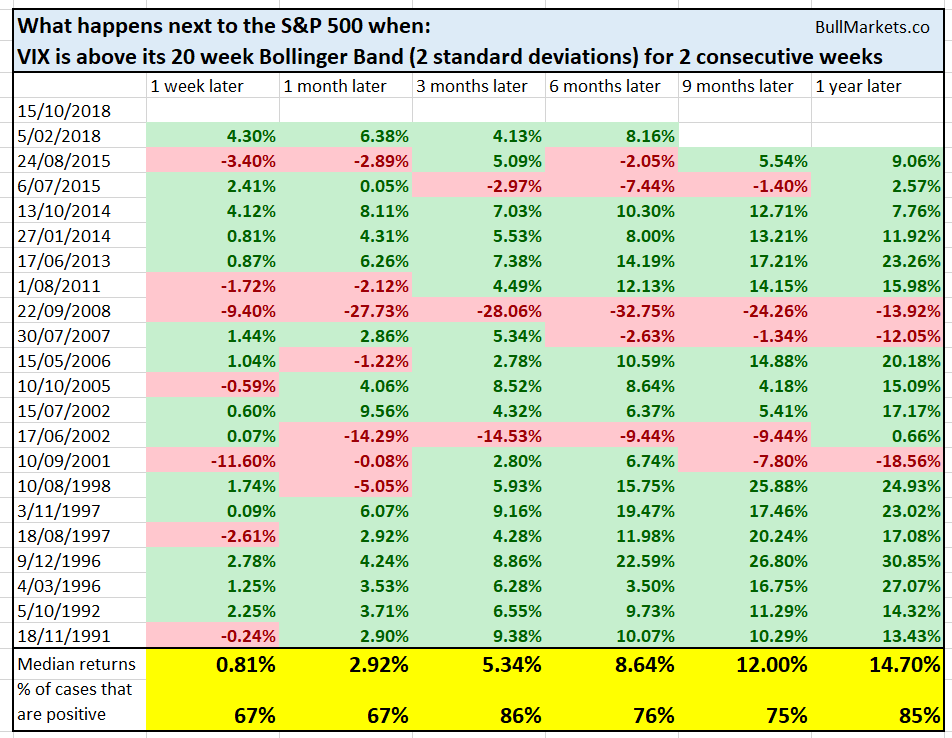
The S&P went up 3 months later in all but 3 cases: June 2002, September 2008, and July 2015. The 2002 and 2008 cases clearly do not apply to today: they occurred when the U.S. stock market had already crashed more than 30% and was deep in a bear market/recession. Different context.
And it’s not just the U.S. stock market that’s likely to make a medium term bounce soon. The Chinese stock market and emerging markets have cratered this year. They’re approaching levels that are medium term bullish, from a contrarian perspective.
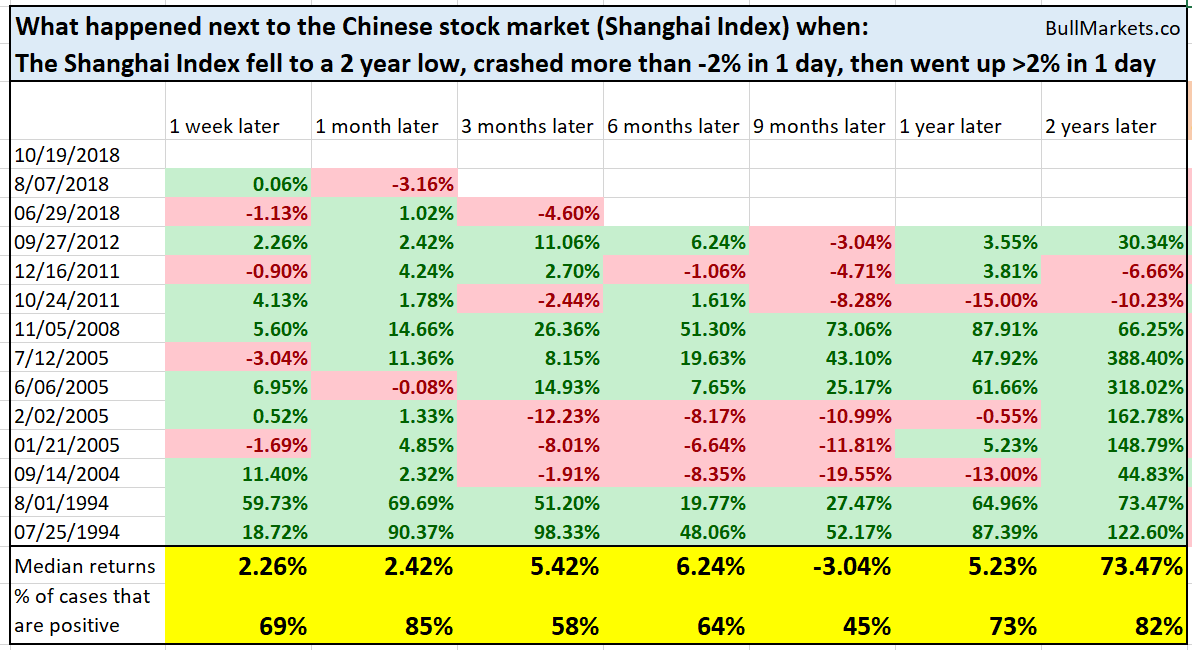
Last week, the Chinese stock market crashed to a 2 year low, and then reversed upwards strongly.
Source: Investing.com
Historically, this meant that the Chinese stock market would make a 1 month bounce.
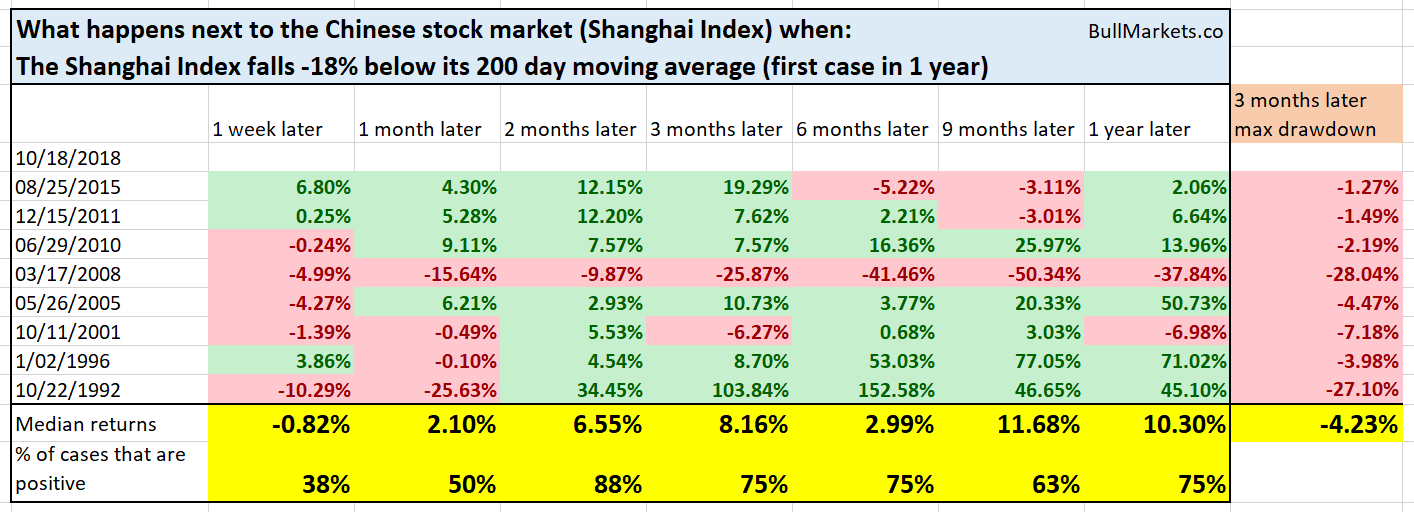
Another way to look at the Chinese stock market is to measure the Shanghai Index’s distance from its 200 day moving average.
The Shanghai Index is now more than -18% below its 200 dma. Historically, this usually led to a 2 month bounce.
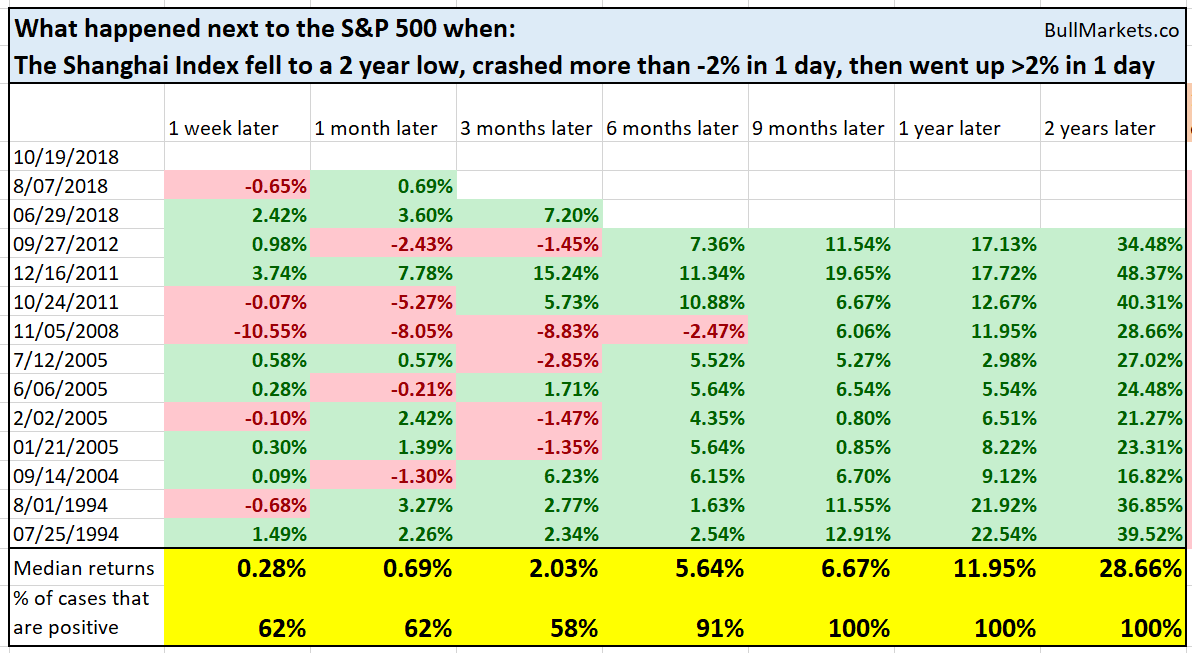
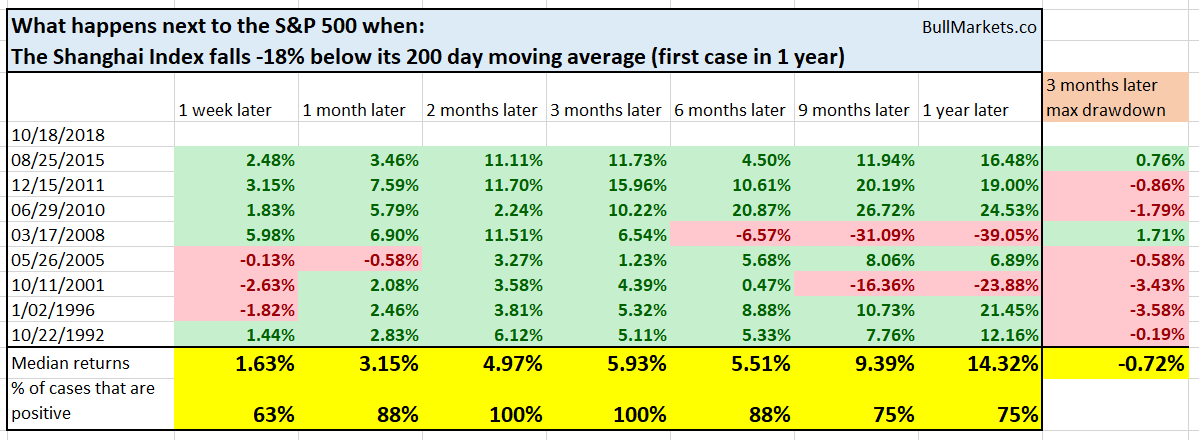
As a result, fears of end-of-the-world “contagion” from China to the U.S. are unfounded. When the Chinese stock market is as oversold as it is now, the U.S. stock market tends to go up in the next year.
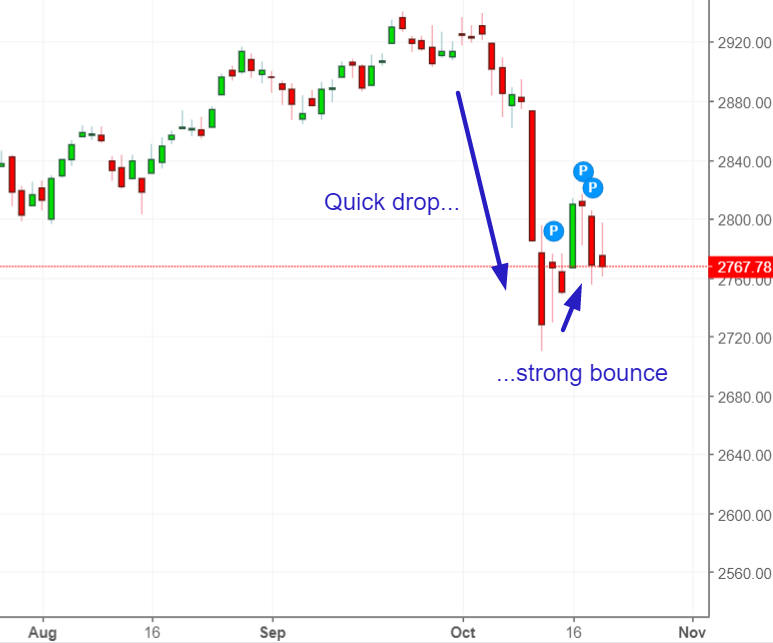
Last week, the S&P 500 tried to make a strong reversal. While these strong reversalsoften fail in the short term (i.e. retest of the lows), they are a long term bullish sign. People are still “buying the dip”.
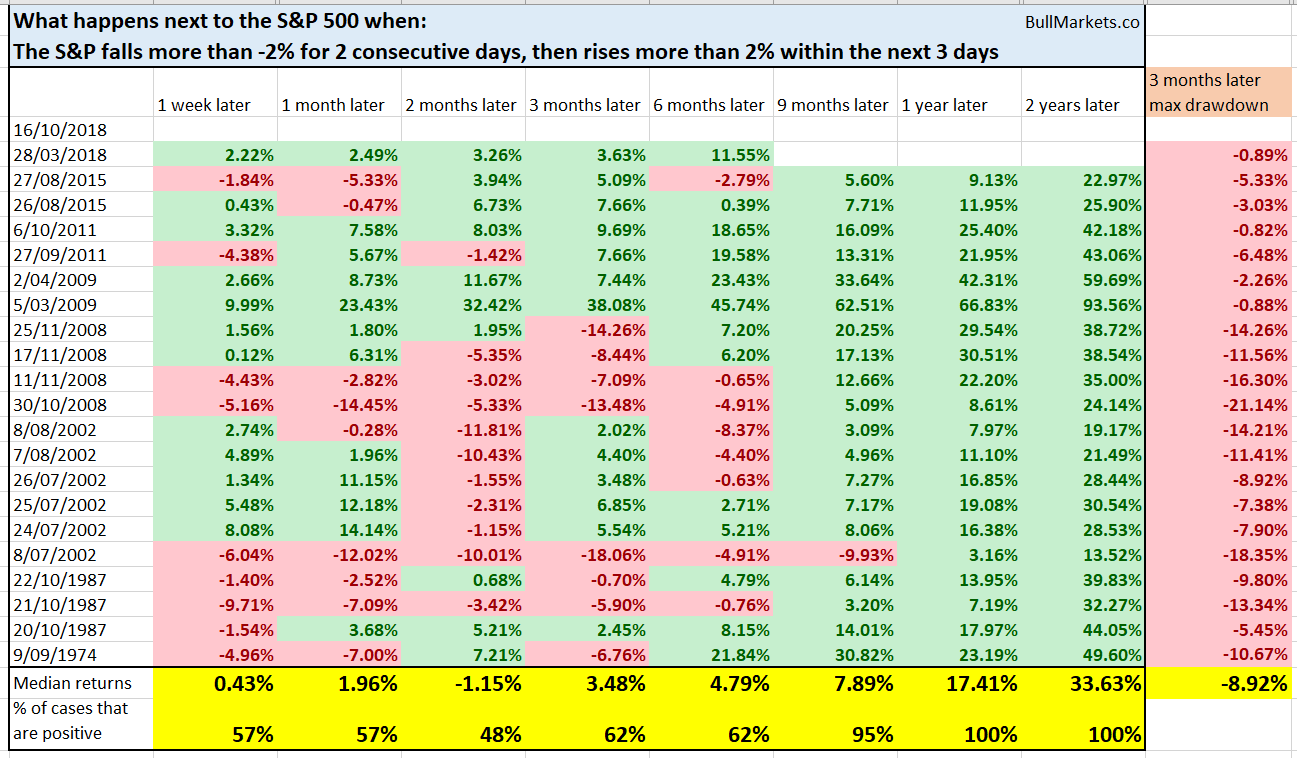
Last Tuesday, the S&P went up more than 2% after falling more than -2% for 2 consecutive days. These quick reversal patterns are very bullish for the next 1 year.
Historically, the U.S. stock market always went up 1 year later.
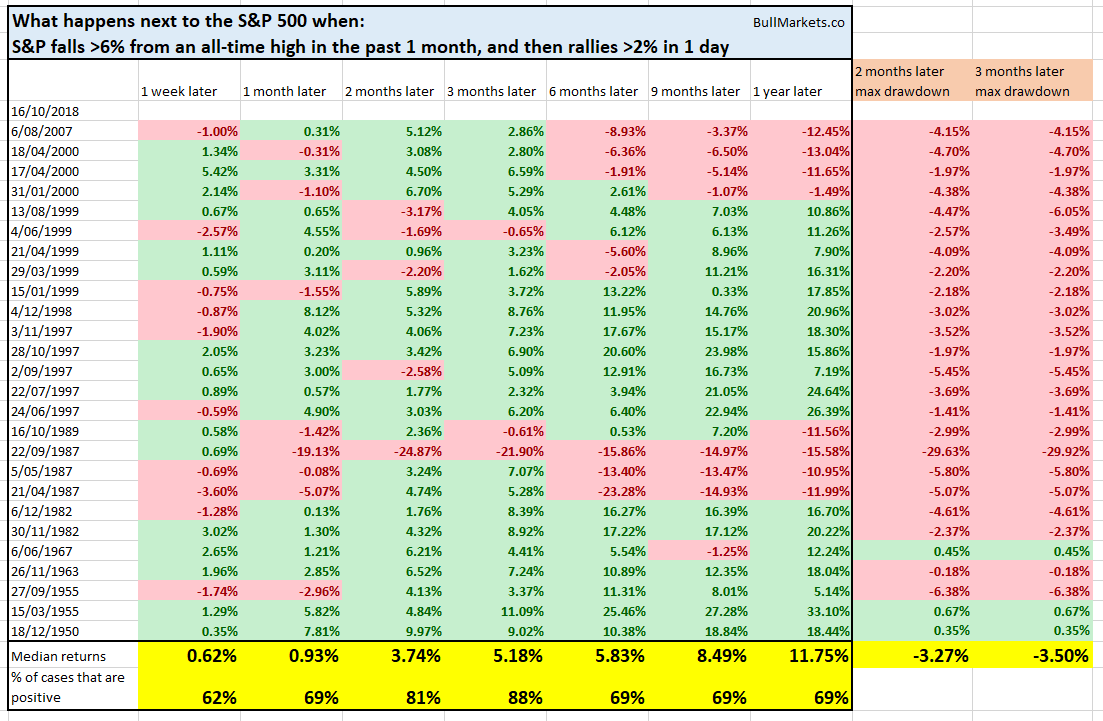
Likewise, the S&P fell more than -6% over the past 1 month, and then rallied strongly last Tuesday. These quick declines followed by a quick bounce are typical of corrections within a bull market. 3 months later, 88% of cases saw the S&P go higher.
Short Term
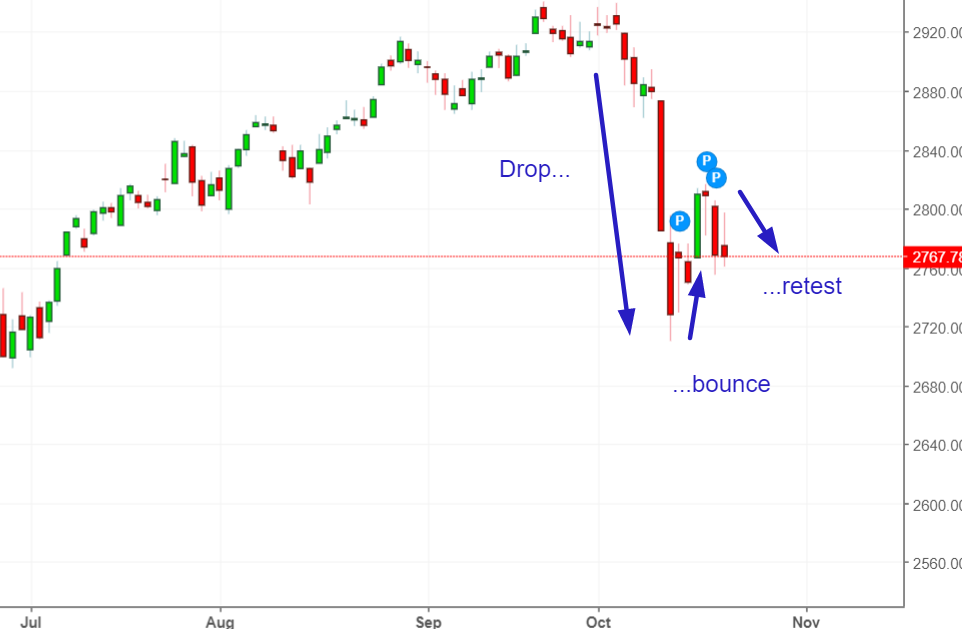
Last week we said that the U.S. stock market’s short term outlook is bearish. These sort of quick declines are usually followed by a bounce and then a retest of the lows.
The U.S. stock market is doing that right now.
With that being said, it’s impossible to predict the exact short term bottom. Any prediction is no better than a “guess”.
Conclusion
- The stock market’s long term is bullish (even though this bull market probably has less than 1 year left).
- The stock market’s medium term risk:reward is bullish.
- The stock market’s short term leans bearish. The U.S. stock market is in a normal “retest pattern”.
Focus on the medium term and risk:reward. The stock market can fall more in the short term. But the simple reality is that nobody can consistently and accurately predict the short term.