1. Consolidation Phase
Let's start with the blinking screens and the overall state of the stock market. While I am likely to get tagged with a "Captain Obvious" label here, I think the most important thing to note about the current trend of the major indices is that with one exception, they are all stuck in a sideways consolidation phase.
So, for the S&P 500, Dow Jones Industrial Average, Russell 2000 Smallcaps, and the Midcaps, we're dealing with a range-bound market. The range is fairly obvious for the S&P, with the high end up at 3230 and the low end down around the 2965 zone.
My take is that the major indices have been digesting the massive run that began on March 24, 2020, and will likely continue to do so for a while.
This sideways action can be seen everywhere except NASDAQ and Nasdaq 100, which, of course are dominated by the megacap tech names that are #winning in the COVID world. A quick glance at a chart of these to indices tells the story here. While the rest of the indices are going nowhere fast, the NDX is trending up nicely.
And from my seat, unless the trend in new cases of COVID starts to decline in a meaningful fashion and the economy successfully reopens (and stays open), our bet is that investors will continue to favor those COVID winners such as AMZN, NFLX, MSFT, FB, AAPL, GOOGL, PYPL, NVDA, ADBE, SHOP, W, DOCU, ZM, etc.
Why? Because this is where predictable and dependable growth can be found during a time of great uncertainty.
Sure, these names have been on a tear for quite some time (no, let's make that, a very long time). And yes, it can be argued that this trend may be overdone and that these names are over-owned. But as the manager of a discretionary stock portfolio, I am planning on sticking with these winners until the environment changes.
Remember, investors want to go where the growth is. And while I want to believe that the hotel names such as Hilton (NYSE:HLT) and Marriott International (NASDAQ:MAR) will continue to recover and that folks will start to board planes again en masse soon, I'm much more comfortable sitting with a big slug of my portfolio in the big, dependable growth names. Well, for now at least.
2. About That Recovery Trade...
Next, I'm of the mind that the mean reversion/recovery trade may have run its course for now. You've all heard the stories of retail traders bombing into the names that have been beaten down the most. This is a classic rebound play after a waterfall decline. However, while the cruise ships have bounced a bit, I'm just not sure how much more upside there can be in this "trade" in the near-term.
The bottom line is that businesses that are negatively impacted by social distancing are unlikely to return to "normal" until/unless there is a medical solution to COVID-19. However, given enough time, I have little doubt that the airline and restaurant businesses will find ways to make money - even in the "new normal" environment we now live.
For example, a neighbor is a pilot for American and he reports that they are flying "a ton" of freight to places like Hawaii in order to get the big box stores the merchandise they need. But in the near-term, this type of "new normal" business isn't likely to make up the shortfall.
So, if you have a long-term time frame, it's probably a good time to start nibbling at the airlines. But I think you need to be able to look ahead a year or two at least.
3. Don't Fight The Fed (Especially Now)
Point number three is that markets continue to be buoyed by stimulus and an ultra-easy Fed. A Fed that "isn't thinking about thinking about raising rates." And if I've learned anything over my 33 years as a money manager it is that you don't want to fight the Fed. Ever. Especially when they are on a mission.
And make no mistake about it; this Fed is on a mission. Like Ben Bernanke during the Great Financial Crisis, Jay Powell and Company are going to do everything/anything in order to prop up the economy. End of story.
Another part of this lesson is investors must remember that we live in a global world and that "money goes to where it is treated best." The bottom line here is the U.S. remains the best place in the world to invest. And money continues to find its way into our stock and bond markets.
4. What Markets Want To See
Missouri is known as the "show me" state. And since I feel that the markets may want to "see" more in terms of real economic progress before a true "recovery" trade can take hold, a great many investors appear to be from Missouri these days.
Stocks have enjoyed the initial bounce in the economic data and the markets. But there is a BIG difference from a bounce in the data of the dead cat variety and true economic growth. As such, I'm of the mind that investors will want to "see" the economy/earnings to actually improve before they move away from their "dependable growth" trade that is driving the NASDAQ 100 higher.
When asked about the second half of 2020, Sam Stovall, chief investment strategist at CFRA, offered up a similar view. Last week, Mr. Stovall wrote, "The second half needs to be a 'show me' period, proving that our optimism was justified. We'll need to see continued improvement in the economic data, and I think we need to see upward revisions to earnings estimates."
So, for a while, stocks can certainly move up on "expectations" for the economy and earnings to continue to rebound. But for me, the question of the day is, how long will it take for real growth to return to both areas?
If "real" growth can return within the next 6 - 9 months, then-current stock prices are certainly justified and there would appear to be some upside ahead. However, if the recovery is weaker than expected or worse, delayed, there may be some "price discovery" to deal with. So, stick around, this ought to be interesting.
Weekly Market Model Review
Each week we do a disciplined, deep dive into our key market indicators and models. The overall goal of this exercise is to (a) remove emotion from the investment process, (b) stay "in tune" with the primary market cycles, and (c) remain cognizant of the risk/reward environment.
The Major Market Models
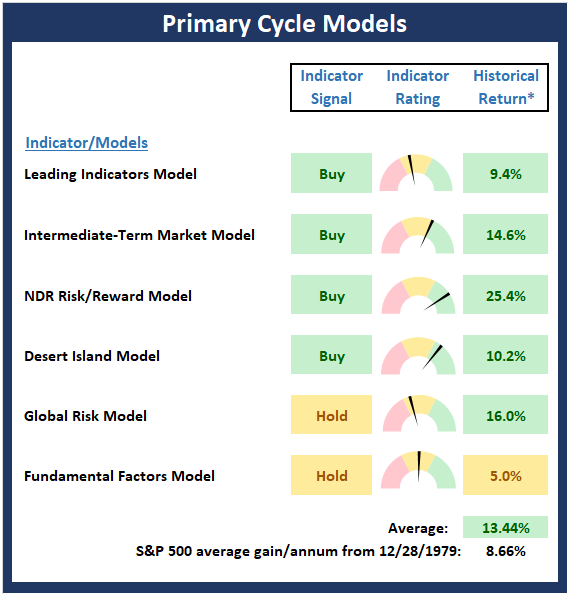
We start with six of our favorite long-term market models. These models are designed to help determine the "state" of the overall market.
There are no changes to report on the Primary Cycle board this week. Overall, I continue to believe the board supports the idea that stocks are currently in the midst of a cyclical bull market and suggests that the bulls should be given the benefit of any doubt. However, it is important to keep in mind that there will be bumps in the road ahead.
* Source: Ned Davis Research (NDR) as of the date of publication. Historical returns are hypothetical average annual performances calculated by NDR. Past performances do not guarantee future results or profitability. This is not individual investment advice.
The State of the Fundamental Backdrop
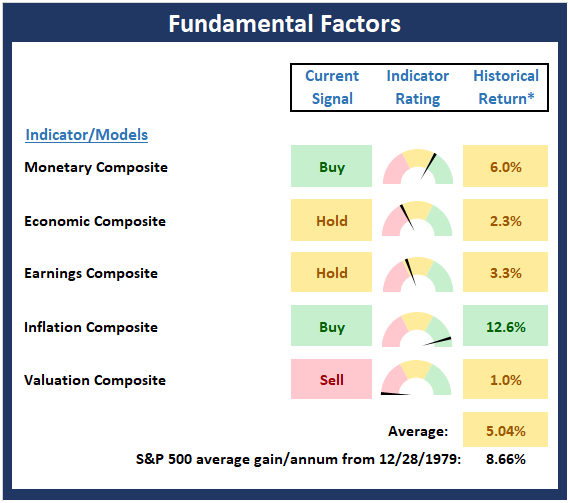
Next, we review the market's fundamental factors in the areas of interest rates, the economy, inflation, and valuations.
There are also no changes to the Fundamental Factors board to report this week. As I've mentioned a time or two this year, I continue to take the readings from the economic and earnings composite with a hefty grain of salt. The bottom line is we just don't know how far both can recover from the recent self-induced historic declines. And to make matters all the more challenging, the next important move in stocks is likely to be driven by the state of the economy/earnings. (Unless the government decides to drop more money from the sky, of course!)
* Source: Ned Davis Research (NDR) as of the date of publication. Historical returns are hypothetical average annual performances calculated by NDR. Past performances do not guarantee future results or profitability. This is not individual investment advice.
The State of the Trend
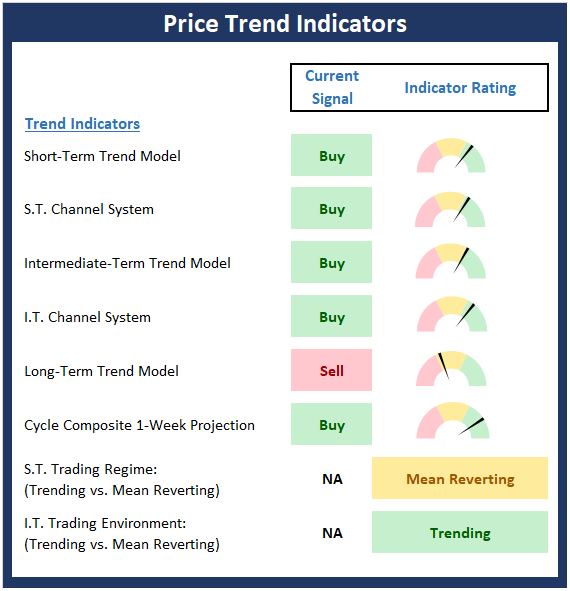
After looking at the big-picture models and the fundamental backdrop, I like to look at the state of the trend. This board of indicators is designed to tell us about the overall technical health of the current trend.
The trend board improved nicely last week. But in reality, the S&P 500 remains stuck in a sideways range between 2965 on the downside and 3230 on the upside. My take is the sideways action represents a consolidation of the massive rebound that began on March 24, 2020. So, we will be watching/waiting for a breakout of this range for clues about the next meaningful move.
This is not individual investment advice.
The State Of Internal Momentum
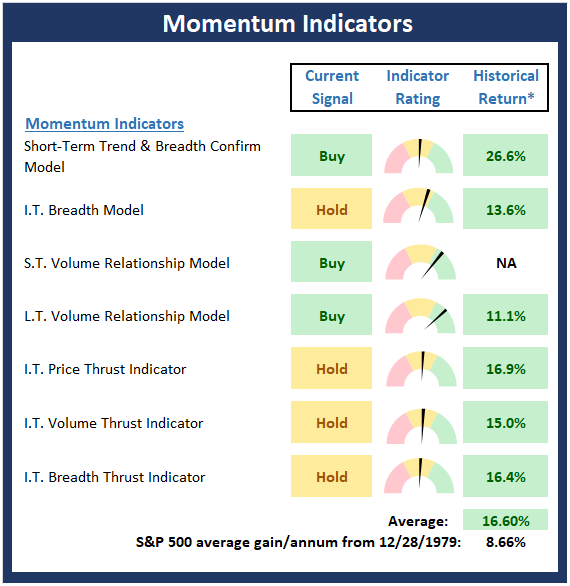
Next, we analyze the "oomph" behind the current trend via our group of market momentum indicators/models.
The Momentum Board saw modest improvement last week as our short-term trend and breadth confirm model flipped from negative to positive. However, this is a very sensitive indicator and thus could easily slip back into the red with a few bad days. It is also worth noting that both of our volume relationship models remain positive since volume is the lifeblood of a bullish environment.
* Source: Ned Davis Research (NDR) as of the date of publication. Historical returns are hypothetical average annual performances calculated by NDR. Past performances do not guarantee future results or profitability. This is not individual investment advice.
Early Warning Signals
Once we have identified the current environment, the state of the trend, and the degree of momentum behind the move, we then review the potential for a counter-trend move to begin. This batch of indicators is designed to suggest when the table is set for the trend to "go the other way."
The Early Warning board continues to be a mixed bag. I will note that both our short-term VIX and overbought/sold indicators are close to flashing sell signals, which suggests that the board is leaning a little toward the bearish side of the field. However, overbought conditions can stay in effect for long periods of time and the VIX is trending lower. Both would be considered positives. So, as I said, the board is a mixed bag here and doesn't really support either team's case.
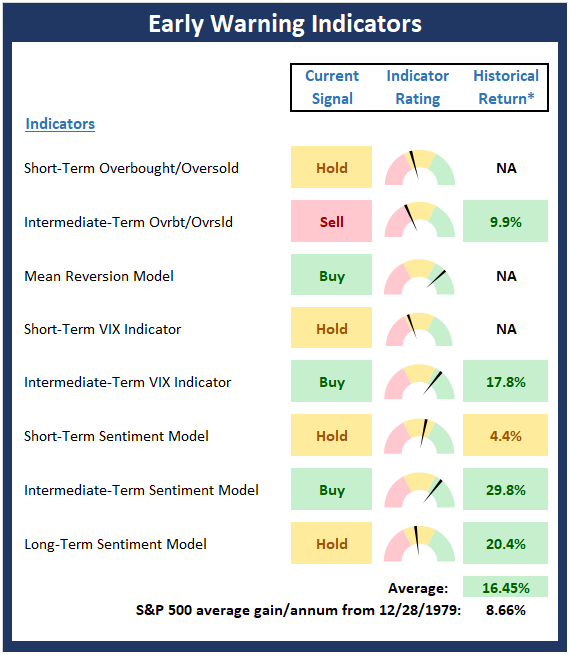
* Source: Ned Davis Research (NDR) as of the date of publication. Historical returns are hypothetical average annual performances calculated by NDR. Past performances do not guarantee future results or profitability - NOT INDIVIDUAL INVESTMENT ADVICE.
Thought For The Day:
Few can be as persuasive as those not hampered by the facts. -Anonymous
Wishing you green screens and all the best for a great day,
