Get 40% Off
🚨 Volatile Markets? Find Hidden Gems for Serious OutperformanceFind Stocks Now

Market Levels Just Plain Stupid

Published 04/23/2021, 03:27 PM
Updated 07/09/2023, 06:31 AM

Moments ago, I saw that Zero Hedge ventured into an area that they normally don’t, which is classic technical analysis (which is, I say selfishly, kinda my thing). They offered up this long-term chart of the Dow:
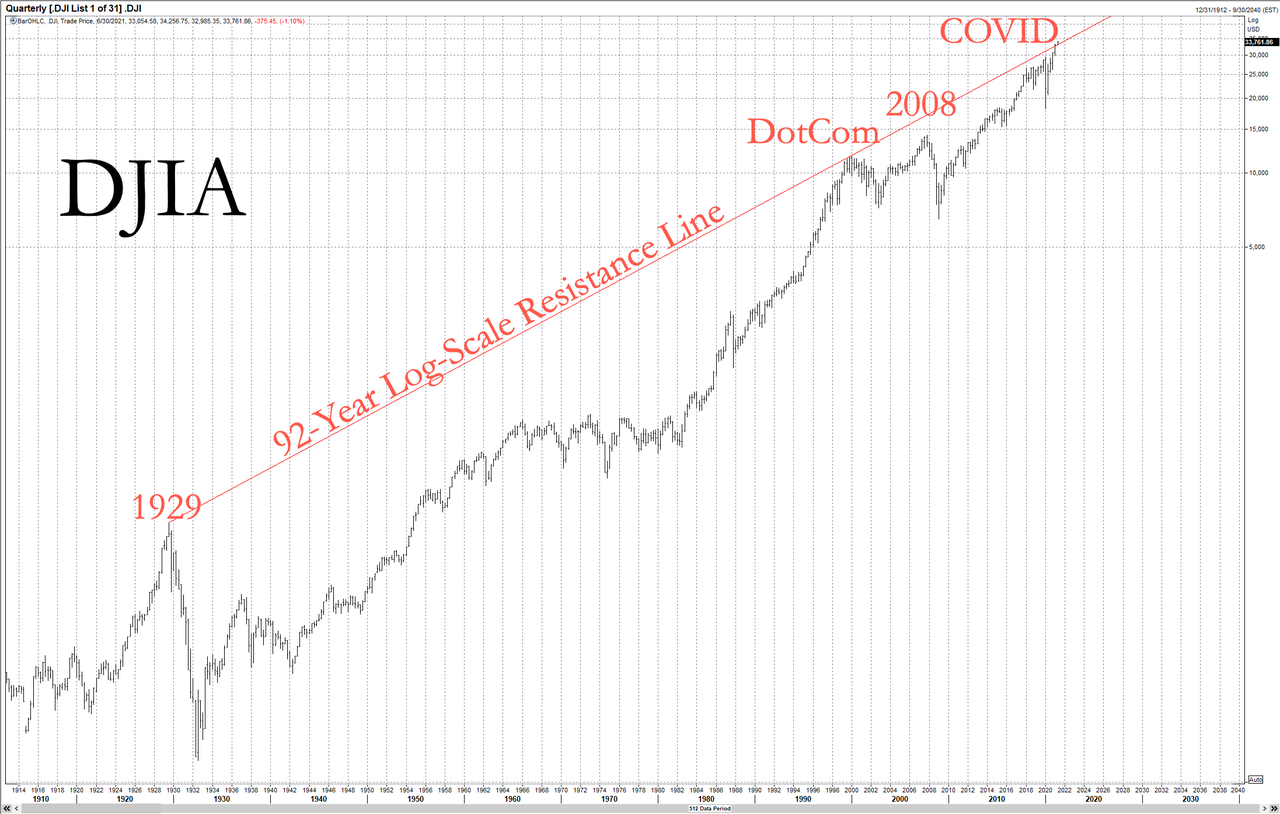
DJIA Chart

I was naturally intrigued, particularly when they showed the zoomed-in portion:
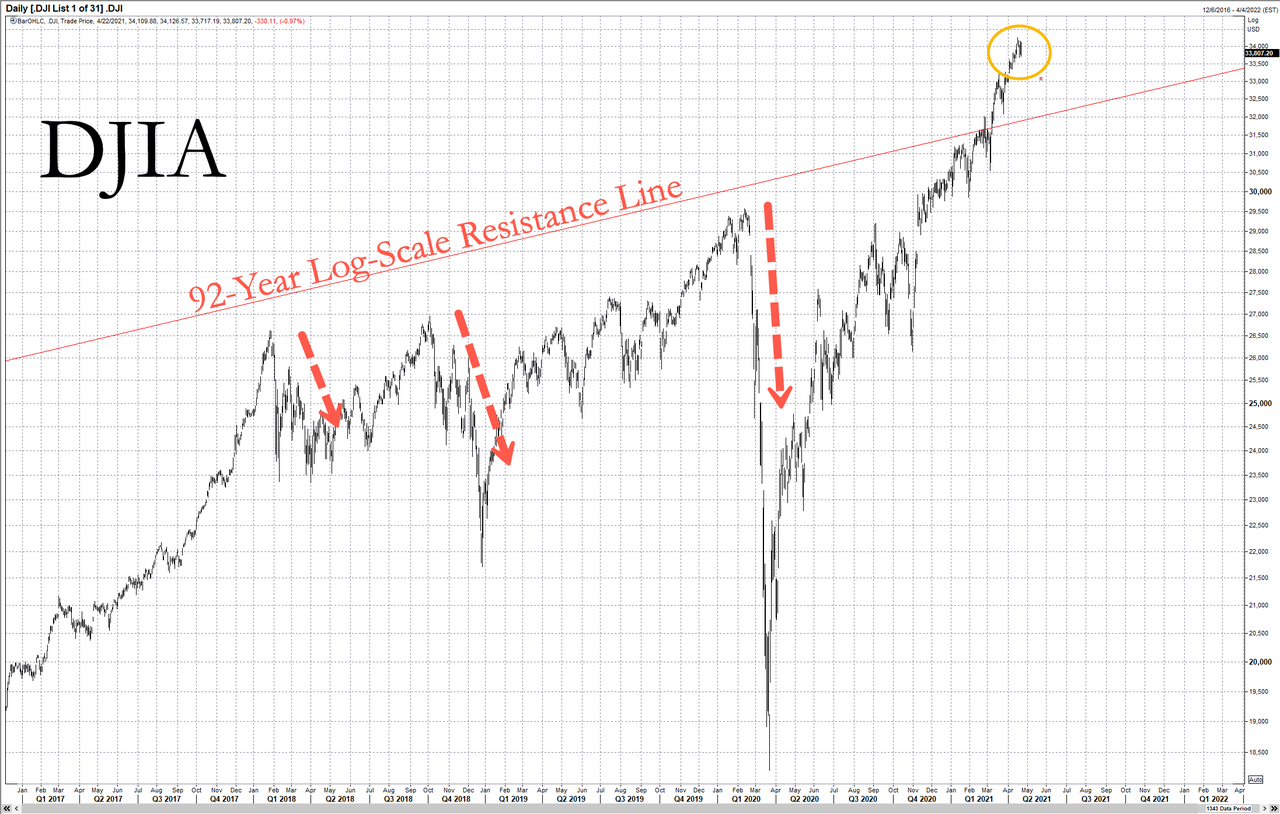
DJIA Chart

When I saw that trendline floating around in empty space, my Oh I Could Do That So Much Better detector started beeping frantically, so I fired up SlopeCharts.

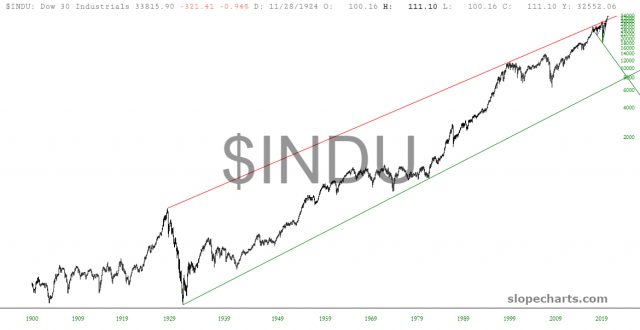
Here is the Dow Industrials, going all the way back to when people still used horses to get around and having running water in the house was a luxury. Take careful note of that gorgeous channel pattern from the peak of the Roaring Twenties to the present Fiat Twenties:
INDU Chart

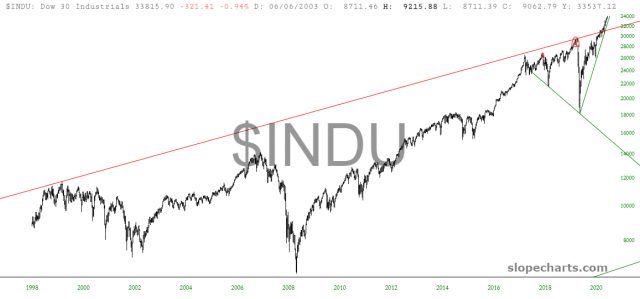
Let’s zoom in to the last quarter century, which begins with the Internet bubble and comes right up to the present. As you can see, we last tagged that century-long trendline in 1999, and then we did so repeatedly in the past few years.
INDU Chart

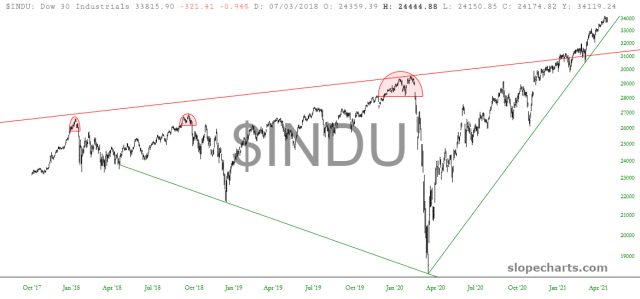
Let’s zoom in further still. We can see, tinted in pink, numerous times when the market “topped out” and took a fall. The last time this happened was at the beginning of 2020, which is when we got the most exciting fall in the market in a dozen years. Since then, it has been, thanks to Powell’s trillions and trillions of J-Bux, vomiting higher without a care or concern, shattering the bounds of a resistance line that had been in place for a solid century.
3rd party Ad. Not an offer or recommendation by Investing.com. See disclosure here or remove ads .
INDU Chart

This is what I call the J.P.S. zone, which is Just Plain Stupid. What I mean by that is that long-term patterns matter. The longer they are, the more they matter.

Late in 2019 and early in 2020, it’s not like the world was devoid of assistance from the central banks of the world. On the contrary, the central banks have been drowning the markets in “help” since 1987, and that “help” went into overdrive starting in 2008. Even so, the trendline continued to be obeyed, and all holy hell broke loose in February 2020 without one moment of warning. Thus, we should have fallen again—quite hard!—starting two or three months ago, and yet we’re out here in the ionosphere.
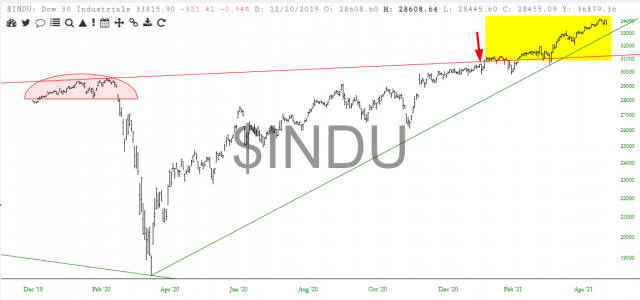
INDU Chart

When the next fall comes, I think it’ll be even more violent than what we saw during the Covid Crash, and the things that the government uses to fix it will be even stupider than anything else they’ve done in the past (if you can imagine).

I would also state that if you look at a broader equity index, such as the S&P 500, its own patterns quite plainly show what a precarious position equities are in right now.
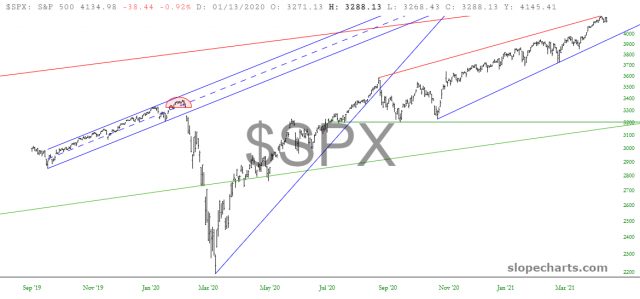
SPX Chart

Selfishly (there’s that word again), I would love this idiotic and totally fake bull market to go on for a little while longer, mainly because I was one of the first investor in a company whose value has gone from $7 million to almost a billion dollars, so, yeah, I’d LOVE to get out at the top. If the world blows up, well, I’ll be the proud owner of a lovely stock certificate of a private company, suitable for framing.

3rd party Ad. Not an offer or recommendation by Investing.com. See disclosure here or remove ads .

Last time I checked, though, the market didn’t really care much what Tim Knight thinks. I hope you do, though, which is why I shared the charts above. The levels we are at are Just Plain Stupid, and this ain’t gonna last. Honest.

Latest comments

Well, people trading in the market cares what Tim Knight thinks. Thanks for another great article.
oh, what a glorious summer it will be, haha. you'll be on the right side of history before labor day.
should start flipping a coin. then you could improve and be right half the time
Complete BS. You can make these charts look however you want with the right manipulation. Markets will keep climbing, major rebound post Covid
If a piece of plywood cost $39 in 2020 and is $94 in 2021, is the Dow priced in fiat really higher?
BTW, I wonder what the inflation adjusted DOW would look like charted?  And not the current contrived models.  Pre-1982 actual inflation models.
There are some good values buried in there.  Low p/e high dividends.
The problem with a trend line "resistance" analysis is twofold:. picking the time interval and assuming there is resistance to movement which can alter the "trend."
I hope that you will continue writing pieces and analysis until you are an old man and retire. You look young and your writing and opinions are well supported. SUPERB! Thank you. YOU ROCK, Tim Knight!
every since the government started intervening, it's changed everything and created a ridiculous expectation that we should never accept a healthy drop
Looks like the big companies will stay afloat for a long time this way...
I agree and my huge pile of cash is ready for the dip... I bailed at the highs of 2019 and won, ready for a repeat.
Same here
is this satire? the lack of actual analysis here is hilarious
Gotta love that 92-year random resistance line
It wasn't random while I was living it.
more people will die due to hunger and indignity than due to Covid caused by over eating and indulgence into exotic bats
stock Market will go down but very slowly. the only reason stocks will go down will be withdrawal of support and the accompanying higher rates.
But u have to understand that there are more and more wealthy people each decade. Like how many could buy stocks at 1930's or 2000 versus how many can buy now? And this trend will continue. World changes.
I’ve been waiting for a major correction for 3 years. Everything is overvalued. Fundamentals will get their way.
but when will the time come
Buy Gold and wait if you can find any.
Sooner or later the fundamentals will assume control. This top-heavy, artificially grown economy will start dropping its limbs. Leverage is off the charts, and I would submit Archegos will prove to be the canary in the coal mine.
We all know what happens to mice caught on the dance floor when the elephants stop dancing and head for the door. I'm sitting this one out. - One of da mice....
When do you predict this fall to happen? I hear “post summer” has been the general consensus
"this time is different" seriously it is
"The markets can stay irrational longer than you can solvent"
Risk Disclosure: Trading in financial instruments and/or cryptocurrencies involves high risks including the risk of losing some, or all, of your investment amount, and may not be suitable for all investors. Prices of cryptocurrencies are extremely volatile and may be affected by external factors such as financial, regulatory or political events. Trading on margin increases the financial risks.
Before deciding to trade in financial instrument or cryptocurrencies you should be fully informed of the risks and costs associated with trading the financial markets, carefully consider your investment objectives, level of experience, and risk appetite, and seek professional advice where needed.
Fusion Media would like to remind you that the data contained in this website is not necessarily real-time nor accurate. The data and prices on the website are not necessarily provided by any market or exchange, but may be provided by market makers, and so prices may not be accurate and may differ from the actual price at any given market, meaning prices are indicative and not appropriate for trading purposes. Fusion Media and any provider of the data contained in this website will not accept liability for any loss or damage as a result of your trading, or your reliance on the information contained within this website.
It is prohibited to use, store, reproduce, display, modify, transmit or distribute the data contained in this website without the explicit prior written permission of Fusion Media and/or the data provider. All intellectual property rights are reserved by the providers and/or the exchange providing the data contained in this website.
Fusion Media may be compensated by the advertisers that appear on the website, based on your interaction with the advertisements or advertisers.
© 2007-2024 - Fusion Media Limited. All Rights Reserved.