Financial markets often present cross-sectional correlations throughout many asset classes. For example, while crude oil and the energy sector tend to move in sync, gold and equities like to move in opposite directions. Besides the usual suspects in past asset-correlation studies, we would like to point out one important, yet usually overlooked, factor—margin debt.
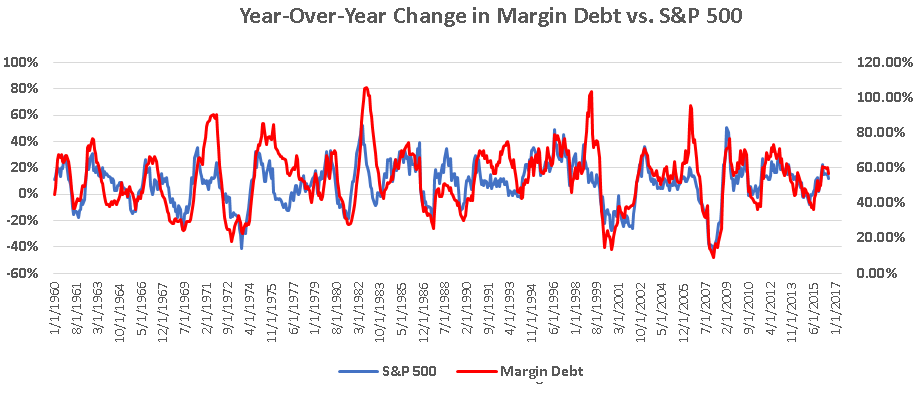
Sometime investors use both cash and the option to borrow from their brokers when purchasing securities. The portion lent to investors is known as margin debt. The advantage of margin debt is that the return on equity is significantly amplified by the use of leverage. Of course, the underlying risk arises—investors must maintain their equity level to avoid a trigger of a margin call. Figure 1 demonstrates the co-movement between NYSE margin debt and the S&P 500 since 1960. The rolling year-over-year changes in NYSE margin debt and the S&P 500 in the past half-century have been stably maintaining that co-movement between 80%—87.86% of the time, on average. This correlation is rather substantial, and it is also quite intuitive: Investors are attracted to risk-on behaviors in a bullish market. Therefore, some strategists may consider a rise in margin debt to be a bullish signal. However, others view high margin debt levels as a red flag. Regardless of which camp you agree with, please keep in mind that these two numbers are merely highly correlated; they do not necessarily predict one another.
Sources: NYSE and Economic Research Federal Reserve Bank of St. Louis
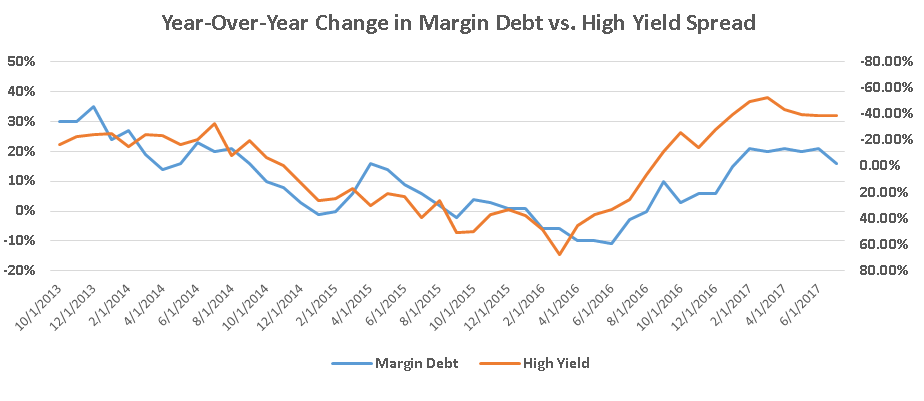
Beyond the question of margin debt’s forecasting power, we find some supporting evidence showing why an increase in margin debt may indicate a bullish view among market participants. Figure 2 below shows the close relationship between NYSE margin debt and the US high-yield spread (inverse). Investors take on more bets in the equity market when corporate credit conditions improve and fewer bets when conditions falters. This behavior helps explain the high correlation between the equity market and margin debt from a fundamental perspective.
Sources: NYSE and Economic Research Federal Reserve Bank of St. Louis
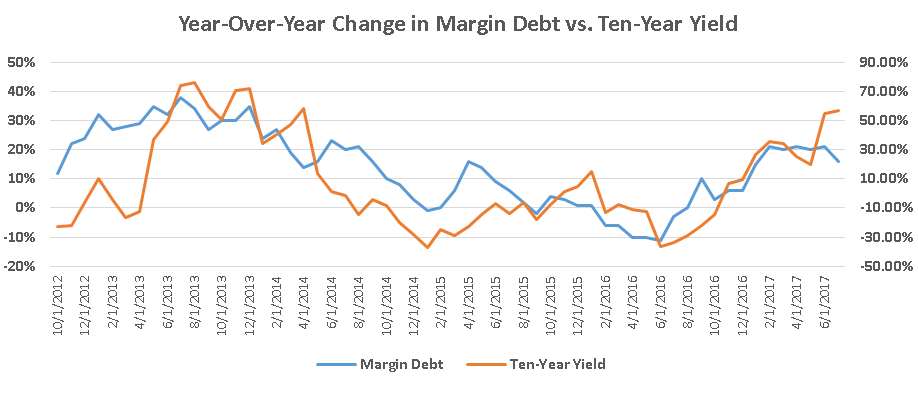
Other interesting evidence suggesting investors’ bullish view comes from the bond market. We find that the 10-year yield is also highly correlated with margin debt. The Great Rotation Theory argues that investors rotate between the bond market and the equity market cyclically. If we view the rise in yield as indicating that investors are pulling cash out of the bond market and putting it into the equity market instead, then the synchronized movement between margin debt and 10-year yield is consistent with the bullish equity perspective.

Sources: NYSE and Economic Research Federal Reserve Bank of St. Louis
In the end, our research simply points out the co-movements in these variables. By no means are we suggesting any causal relationship between the NYSE margin debt and the equity market.
