Get 40% Off
👀 👁 🧿 All eyes on Biogen, up +4,56% after posting earnings. Our AI picked it in March 2024.
Which stocks will surge next?
Unlock AI-picked Stocks

S&P 500 Chart Still Bullish As Long As Support Holds At 2800

Published 08/19/2018, 06:10 AM
Updated 08/01/2018, 09:20 AM

S&P 500 (S&P 500), CBOE Market Volatility Index (VIX), 21-Day Equity Only Put Call Ratio (PC21), and Weighted 21-Day Equity Only Put Call Ratio (PC21 w).

Perhaps the market is merely recharging its batteries for another push higher, but action had generally been lackluster until yesterday's large rally. Once S&P 500 failed three times last week to break out to new highs, it succumbed to selling. That selling culminated with yet another test of the 2800 support level. The market passed that test with flying colors, as a large rally rebounded from there. The take-away from this action is that the S&P 500 chart is still bullish as long as support holds at 2800.
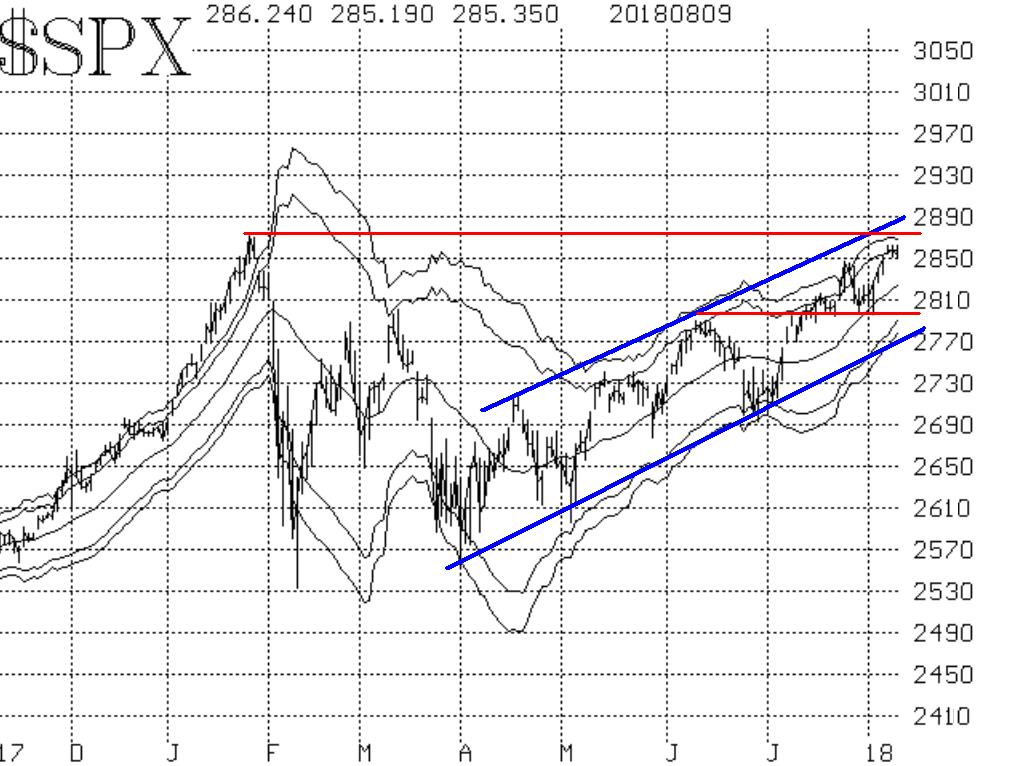
SPX Chart

Most of the other indicators have deteriorated to some extent during the last week. For example, the weighted equity-only put-call ratio (Figure 3) rolled over to a confirmed sell signal. It joins the standard ratio, which has been on a sell signal for some time.
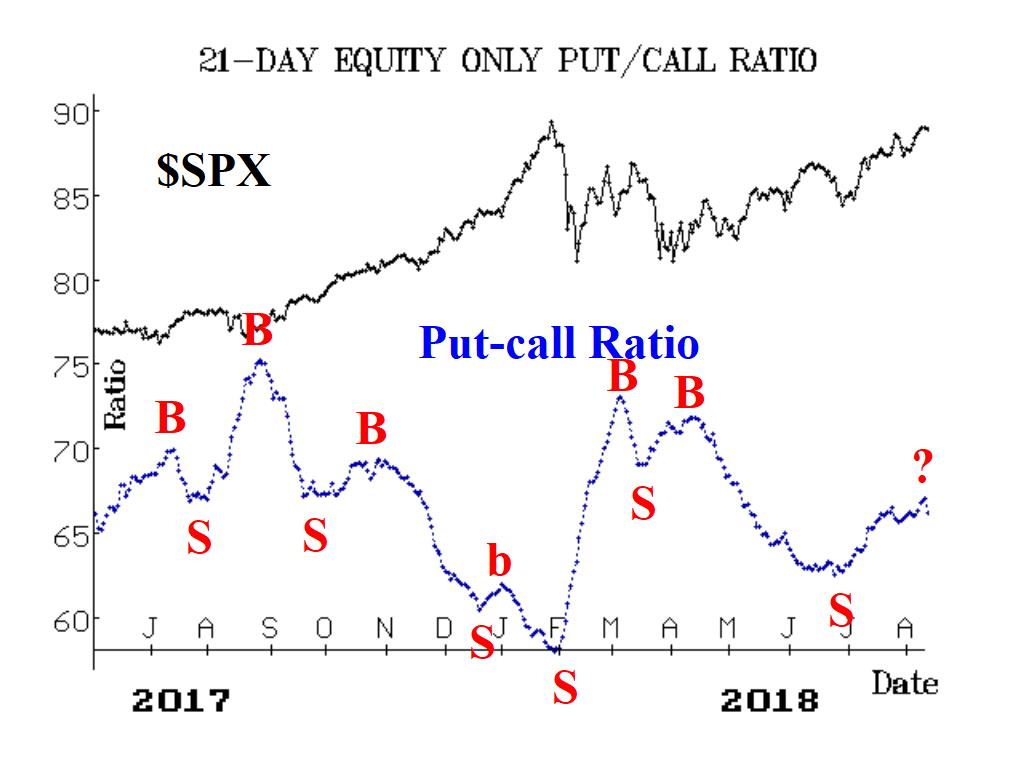
SPX Chart

Market breadth has been relatively weak, and both breadth oscillators remain on sell signals.
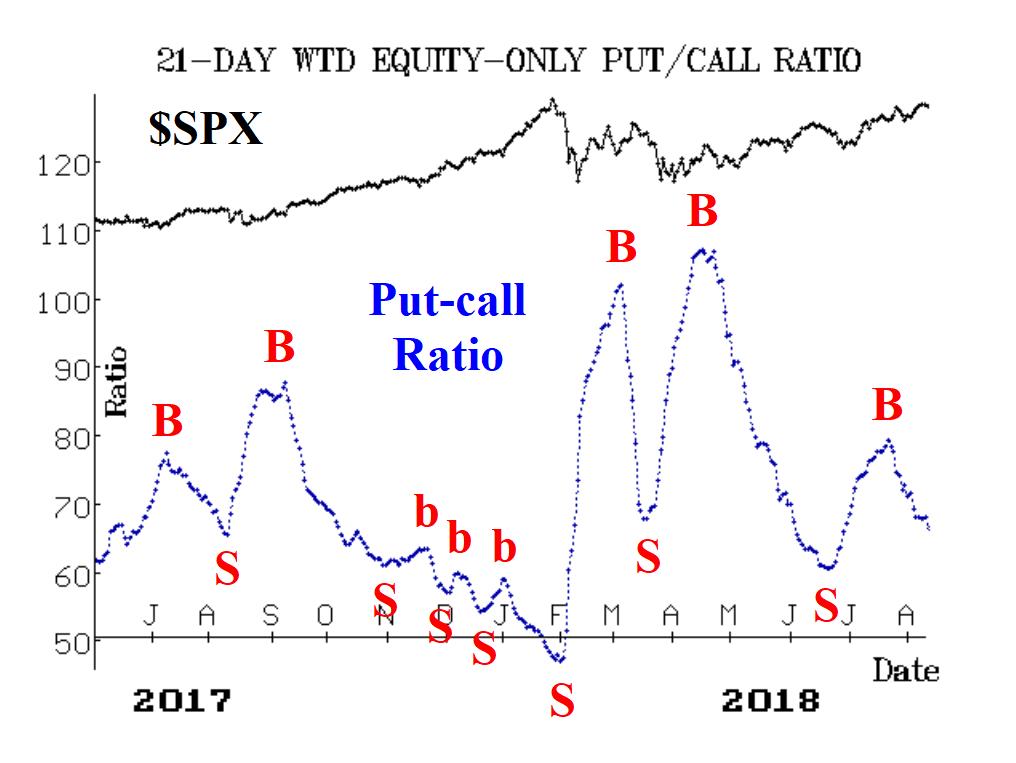
SPX Chart

That brings us to volatility. For a brief time in the past week, it seemed as if volatility were set to turn bearish. When S&P 500 fell back from the 2860 level, VIX suddenly began to spike higher. But the potential bearishness of VIX as an indicator was not realized. VIX never closed above 15, and then plunged on the most recent rally. So VIX is back in the bullish camp.
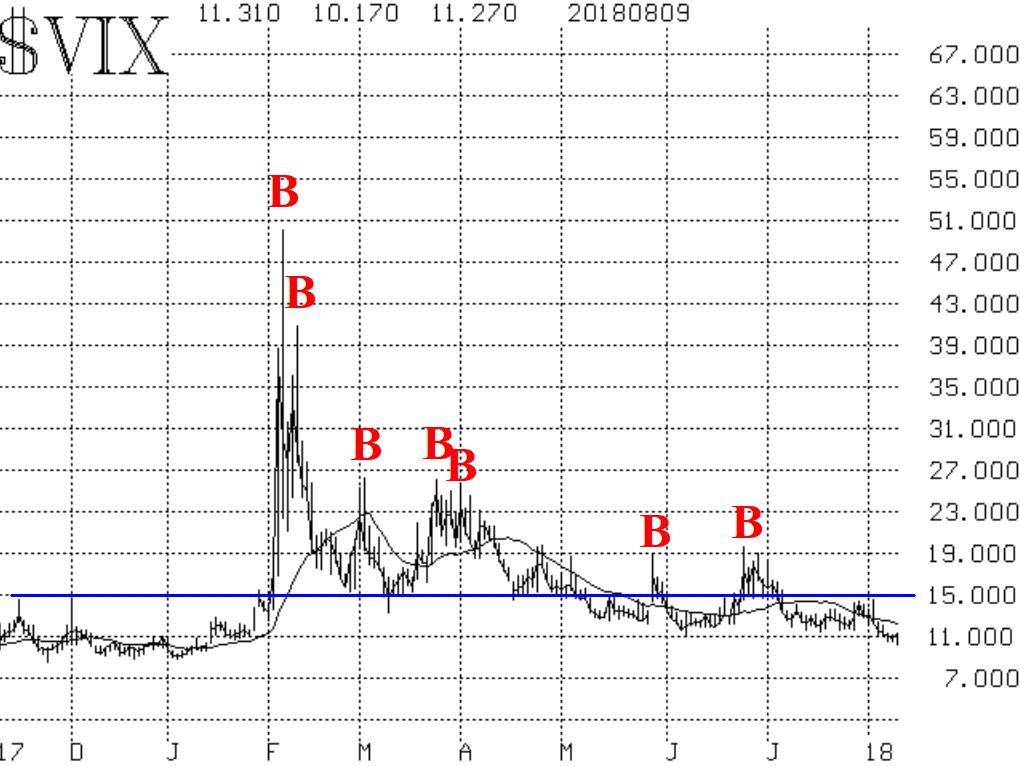
VIX Chart

In summary, despite some negative market moves and among deterioration in the indicators, S&P 500 continues to remain above support and that is the most important factor right now. Thus, the outlook continues to be bullish. That would change, however, with an S&P 500 close below 2795.

3rd party Ad. Not an offer or recommendation by Investing.com. See disclosure here or remove ads .

Latest comments

Risk Disclosure: Trading in financial instruments and/or cryptocurrencies involves high risks including the risk of losing some, or all, of your investment amount, and may not be suitable for all investors. Prices of cryptocurrencies are extremely volatile and may be affected by external factors such as financial, regulatory or political events. Trading on margin increases the financial risks.
Before deciding to trade in financial instrument or cryptocurrencies you should be fully informed of the risks and costs associated with trading the financial markets, carefully consider your investment objectives, level of experience, and risk appetite, and seek professional advice where needed.
Fusion Media would like to remind you that the data contained in this website is not necessarily real-time nor accurate. The data and prices on the website are not necessarily provided by any market or exchange, but may be provided by market makers, and so prices may not be accurate and may differ from the actual price at any given market, meaning prices are indicative and not appropriate for trading purposes. Fusion Media and any provider of the data contained in this website will not accept liability for any loss or damage as a result of your trading, or your reliance on the information contained within this website.
It is prohibited to use, store, reproduce, display, modify, transmit or distribute the data contained in this website without the explicit prior written permission of Fusion Media and/or the data provider. All intellectual property rights are reserved by the providers and/or the exchange providing the data contained in this website.
Fusion Media may be compensated by the advertisers that appear on the website, based on your interaction with the advertisements or advertisers.
© 2007-2024 - Fusion Media Limited. All Rights Reserved.