MAP Pharmaceuticals, Inc. (MAPP), is a development-stage company. As of December 31, 2011, the Company was focusing to advance its product candidate, LEVADEX (MAP0004) orally inhaled migraine therapy, which is an orally inhaled version of dihydroergotamine mesylate (DHE), for the acute treatment of migraine.
This is a vol and order flow note in a stock that has some absolutely bewildering news and risk surrounding it. First, let’s look at the Stats Tab and day’s biggest trades (below) and then we’ll get into the news.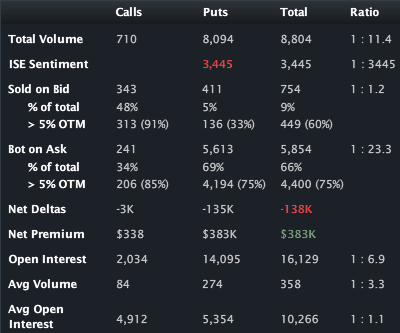
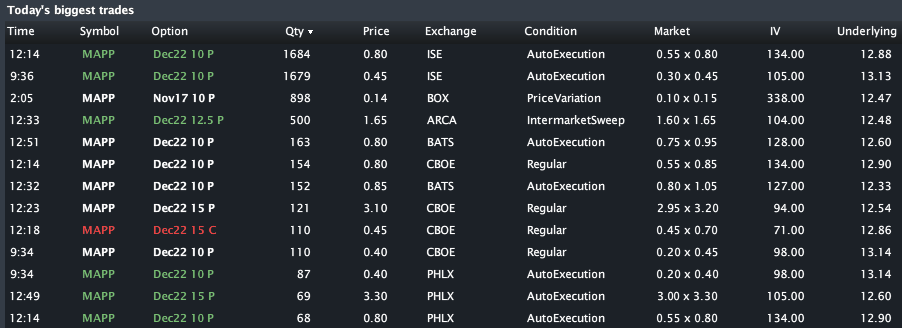
We can see that over 8,800 option contracts have traded already on a total daily average option volume of just 358. The Dec 10 puts are the most active line, with nearly 4,800 changing hands.
So what’s the news? Check this out:
MAPP re-submitted to the FDA for their novel migraine drug (inhaler) Levadex on Oct. 16th, 2012. This was a second attempt at approval following an initial rejection letter in March of this year. But, FDA rules state that the agency has 14 days to accept a re-submission and assign a new approval date decision. So… 14 days after Oct 16th is Oct 30th. Today is Nov 15th and MAPP has still heard nothing from the FDA – I mean zero communication. -- Source: MAP Pharma’s Awkward FDA Silence; TheStreet.com via Yahoo! Finance, written by Adam Feuerstein.
Let’s look at the Charts Tab (six months), below and we’ll see some incredible stuff. The top portion is the stock price the bottom is the vol (IV30™ - red vs. HV20™ - blue vs. HV180™ - pink). 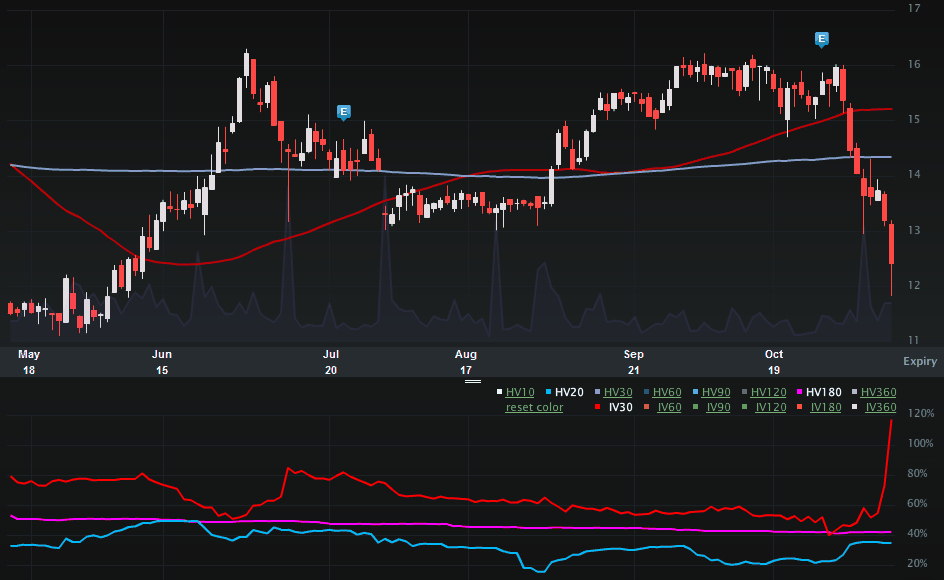
We can see that on 10-31-2012 (the latest date that MAPP should have received some news from the FDA), the stock closed at $15.42. As of this writing, the stock is down ~19% from that date, with an abrupt drop coming in the last week. The 52 wk range in stock price is [$11.11, $17.92], surprisingly small for a small bio-tech development company with FDA submissions.
On the vol side we can see the incredible rise in the implied as the stock has been dropping. On 10-31-2012, the IV30™ closed at 48.56%. As of this writing, the IV30™ is up 134% from that date, with a 60%+ move today alone. The 52 wk range in IV30™ is [34.74, 184.61], putting the current level in the 55th percentile. IMHO, as long as there is no news from the FDA, that vol will rise – and perhaps rise abruptly like today.
Let’s turn to the Skew Tab, below.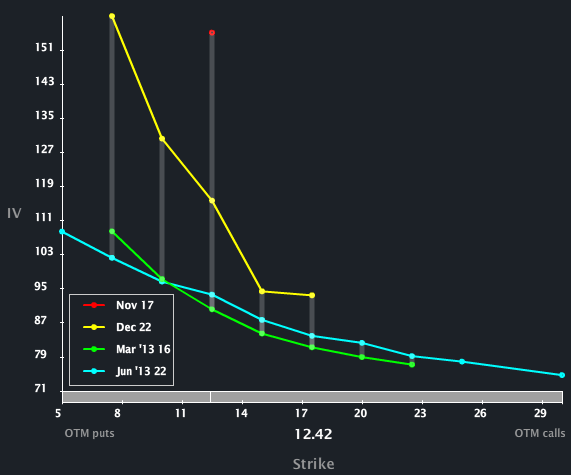
We can see how elevated Dec is to the back months, so the option market does reflect risk (read: FDA news) by Dec expiry. I would hope so?...
Finally let’s turn to the Options Tab.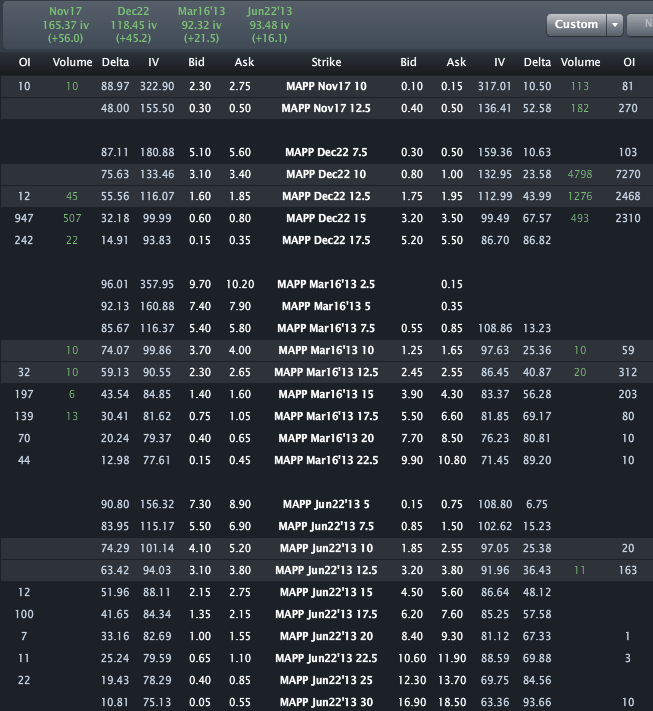
Across the top we can see the monthly vols are priced to 118.45% and 92.32 for Dec and Mar, respectively. Again, that vol diff is the reflection from the option market that “some news” is likely coming in the near-term. In the meantime, check out some specific prices. The Dec 7.5 puts are priced to $0.40 fair value or ~160% vol – whoa. The Dec 17.5 calls are priced to $0.25 fair value or ~94% vol. Keep in mind the 52 wk range for the stock is [$11.11, $17.92],
Disclosure: This is trade analysis, not a recommendation.
Images provided by Livevol®
- English (UK)
- English (India)
- English (Canada)
- English (Australia)
- English (South Africa)
- English (Philippines)
- English (Nigeria)
- Deutsch
- Español (España)
- Español (México)
- Français
- Italiano
- Nederlands
- Português (Portugal)
- Polski
- Português (Brasil)
- Русский
- Türkçe
- العربية
- Ελληνικά
- Svenska
- Suomi
- עברית
- 日本語
- 한국어
- 简体中文
- 繁體中文
- Bahasa Indonesia
- Bahasa Melayu
- ไทย
- Tiếng Việt
- हिंदी
MAP Pharmaceuticals: Development Stage Bio-tech In Unchartered Waters
Published 11/17/2012, 05:39 AM
Updated 07/09/2023, 06:31 AM
MAP Pharmaceuticals: Development Stage Bio-tech In Unchartered Waters
3rd party Ad. Not an offer or recommendation by Investing.com. See disclosure here or
remove ads
.
Latest comments
Install Our App
Risk Disclosure: Trading in financial instruments and/or cryptocurrencies involves high risks including the risk of losing some, or all, of your investment amount, and may not be suitable for all investors. Prices of cryptocurrencies are extremely volatile and may be affected by external factors such as financial, regulatory or political events. Trading on margin increases the financial risks.
Before deciding to trade in financial instrument or cryptocurrencies you should be fully informed of the risks and costs associated with trading the financial markets, carefully consider your investment objectives, level of experience, and risk appetite, and seek professional advice where needed.
Fusion Media would like to remind you that the data contained in this website is not necessarily real-time nor accurate. The data and prices on the website are not necessarily provided by any market or exchange, but may be provided by market makers, and so prices may not be accurate and may differ from the actual price at any given market, meaning prices are indicative and not appropriate for trading purposes. Fusion Media and any provider of the data contained in this website will not accept liability for any loss or damage as a result of your trading, or your reliance on the information contained within this website.
It is prohibited to use, store, reproduce, display, modify, transmit or distribute the data contained in this website without the explicit prior written permission of Fusion Media and/or the data provider. All intellectual property rights are reserved by the providers and/or the exchange providing the data contained in this website.
Fusion Media may be compensated by the advertisers that appear on the website, based on your interaction with the advertisements or advertisers.
© 2007-2024 - Fusion Media Limited. All Rights Reserved.
