
ManpowerGroup Inc. (NYSE:MAN) reported disappointing third-quarter 2019 results missing the Zacks Consensus estimate on both earnings and revenues.
Adjusted earnings of $1.92 per share missed the Zacks Consensus Estimate by a penny and declined 22.3% year over year on a reported basis and 18% on a constant-currency basis. Earnings met the midpoint of the guided range of $1.88-$1.96 per share.
Revenues of $5.25 billion were behind the consensus mark by $101 million. Revenues declined 3.1% year over year on a reported basis but were up 0.3% on a constant-currency basis. Challenging market environment in Europe continues to weigh on the company’s top line.
ManpowerGroup is trying to mitigate this revenue softness through strong pricing discipline and cost control. It continues to witness solid growth at its solutions business, especially in MSP and RPO.
The company’s Greater China JV completed Hong Kong public offering in the quarter, resulting in the deconsolidation of the business. ManpowerGroup remains the largest shareholder.
We observe that shares of the company have gained 40% year to date, significantly outperforming its industry’s rise of 5.2%.
Let’s delve deeper into the numbers.
Segmental Revenues
Revenues from America totaled $1.07 billion, up 2.9% year over year on a reported basis and 5.5% on a constant-currency basis. In the United States, revenues came in $645.7 million, up 2% both on reported and constant-currency basis. In the Other Americas subgroup, revenues of $425 million increased 4.5% on a reported basis and 11% on a constant-currency basis. Americas contributed 20% to total revenues.
Revenues from Southern (NYSE:SO) Europe were up 0.9% on a reported basis and 5% on a constant-currency basis to $2.35 billion. Revenues from France came in at $1.38 billion, down 5.4% on a reported basis and 1% on a constant-currency basis. Revenues from Italy were $376.6 billion, down 8.2% on a reported basis and 3.9% on a constant-currency basis. The Other Southern Europe subsegment generated revenues of $592.9 million, up 28.7% on a reported basis and 31.9% on a constant-currency basis. Southern Europe contributed 45% to total revenues.
Northern Europe revenues declined 10.1% on a reported basis and 5.3% on a constant-currency basis to $1.16 billion. The decline was due to weakness in Germany, Sweden, Belgium and the Netherlands. The segment accounted for 22% of total revenues in the quarter.
APME revenues totaled $621.9 million, down 12.8% on a reported basis and 12.6% on a constant-currency basis. Revenues grew in Japan, Korea, Vietnam, Thailand, Middle East and Singapore, and declined in Australia. The segment contributed 12% to total revenues.
Revenues from the Right Management business were up 2.5% year over year on a reported basis and 4.7% on constant-currency basis to $48.1 million. The segment contributed 1% to total revenues.
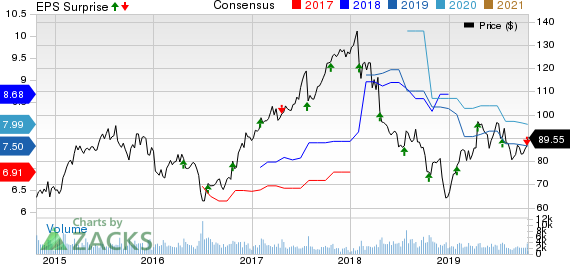
ManpowerGroup Inc. Price, Consensus and EPS Surprise
Operating Performance
Gross profit in the third quarter was $840.3million, down 5.7% year over year on a reported basis and 2.5% on a constant-currency basis. Gross profit margin came in at 16%, down 40 basis points (bps) year over year.
Operating profit of $217 million increased 0.2% year over year on a reported basis and 3.3% on a constant-currency basis. Operating profit margin came in at 4.1%, up slightly year over year.
Balance Sheet and Cash Flow
ManpowerGroup exited the third quarter with cash and cash equivalents balance of $807.1 million compared with $770.4 million in the prior quarter. Long-term debt at the end of the quarter was $983.2 million, compared with $1.03 billion in the preceding quarter.
The company generated $218.3 million of cash from operating activities and Capex was $12.2 million in the quarter. ManpowerGroup repurchased $51 million of common stock in the quarter.
Fourth-Quarter Outlook
ManpowerGroup anticipates earnings per share in the range of $2-$2.08, below the Zacks Consensus Estimate of $2.18. The guidance includes a negative impact of 7 cents from foreign currency.
The company expects revenues to be down 2% to flat on a constant-currency basis. Further, it anticipates income tax rate in the fourth quarter to be around 33%.
Zacks Rank & Stocks to Consider
ManpowerGroup currently carries a Zacks Rank #4 (Sell).
Some better-ranked stocks in the broader Zacks Business Services sector are CoreLogic (NYSE:CLGX) , S&P Global (NYSE:SPGI) and Paychex (NASDAQ:PAYX) . While CoreLogic sports a Zacks Rank #1 (Strong Buy), S&P Global and Paychex carry a Zacks Rank #2 (Buy). You can see the complete list of today’s Zacks #1 Rank stocks here.
Long-term earnings (three to five years) growth rate for CoreLogic, S&P Global and Paychex is estimated at 11%, 10% and 9%, respectively.
7 Best Stocks for the Next 30 Days
Just released: Experts distill 7 elite stocks from the current list of 220 Zacks Rank #1 Strong Buys. They deem these tickers “Most Likely for Early Price Pops.”
Since 1988, the full list has beaten the market more than 2X over with an average gain of +24.50% per year. So be sure to give these hand-picked 7 your immediate attention.
S&P Global Inc. (SPGI): Free Stock Analysis Report
CoreLogic, Inc. (CLGX): Free Stock Analysis Report
ManpowerGroup Inc. (MAN): Free Stock Analysis Report
Paychex, Inc. (PAYX): Free Stock Analysis Report
Original post
Zacks Investment Research