
ManpowerGroup Inc. (NYSE:MAN) reported better-than-expected first-quarter 2019 results.
Earnings per share (excluding restructuring charge) of $1.39 beat the Zacks Consensus Estimate by 4 cents and decreased 19.2% on a year-over-year basis.
Revenues of $5.05 billion surpassed the consensus mark by $123 million and declined 8.6% year over year on a reported basis and 2.2% on a constant-currency basis. A challenging market environment in Europe continues to weigh on the company’s top line.
ManpowerGroup is trying to mitigate this revenue softness through strong pricing discipline and cost control. It continues to witness solid growth at its solutions business, especially in MSP and RPO solutions. To increase productivity and efficiency, the company is making significant investments in front-office systems, cloud-based and mobile applications.
The company purchased the remaining interest in its Switzerland Manpower franchise this month. It will start managing this business in the second quarter. It represents around $500 million in annual revenues and is now part of the Southern (NYSE:SO) Europe region.
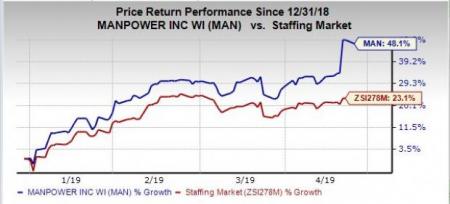
So far this year, shares of the company have gained a massive 48.1%, significantly outperforming its industry’s rally of 23.1%.
Let’s delve deeper into the numbers.
Segmental Revenues
Revenues from America totaled $1 billion, down 1.5% year over year on a reported basis but up 3% on a constant-currency basis. Revenues declined both in the United States and Other Americas subgroups. The segment contributed 20% to total revenues.
Revenues from Southern Europe were down 9.1% on a reported basis and 1.6% on a constant- currency basis to $2.1 billion. Revenues declined across France, Italy and Other Southern Europe. The segment contributed 42% to total revenues.
Northern Europe revenues decreased 16.1% on a reported basis and 8.8% on a constant-currency basis to $1.19 billion. The decline was due to weakness in UK, Germany, Belgium and the Netherlands. The segment accounted for 23% of total revenues in the quarter.
APME revenues totaled $699.9 million, down 2.8% on a reported basis but up 1.9% on a constant-currency basis. Revenues grew in Japan, China, India, Thailand, Malaysia, Singapore and declined in Australia and New-Zealand. The segment contributed 14% to total revenues.
Revenues from the Right Management business declined 8.4% year over year on a reported basis and 4.5% on constant-currency basis to $45.8 million. The downside can be attributed to reduced outplacement activity. The segment contributed 1% to total revenues.
Operating Performance
Gross profit in the fourth quarter was $804.8 million, down 9.1% year over year on a reported basis and 3% on a constant-currency basis. Gross profit margin came in at 16%, down slightly year over year.
Operating profit of $105.5 million declined 31.4% year over year on a reported basis and 26% on a constant-currency basis. Operating profit margin came in at 2.1%, down 70 basis points (bps) year over year.
The America segment’s operating profit amounted to $31.2 million, down 27.2% year over year on a reported basis and 26.1% on a constant-currency basis. Operating profit from Southern Europe was $86.9 million, down 11.1% on a reported basis and 3.9% on a constant-currency basis.
APME registered an operating profit of $20.1 million, which declined 22.3% on a reported basis and 19.1% on a constant-currency basis. The Northern Europe segment’s operating profit declined 96.2% year over year on a reported basis and 95.3% on a constant-currency basis to $0.6 million.
The Right Management segment’s operating profit was $2.1 million, down 67.7% on a reported basis and 66% on a constant-currency basis.
ManpowerGroup Inc. Price, Consensus and EPS Surprise
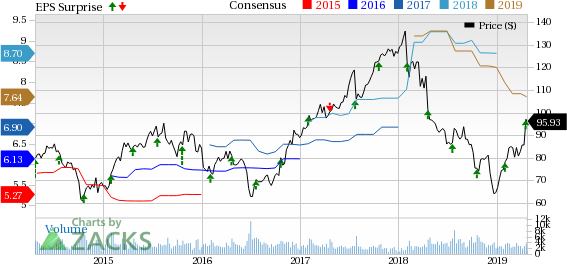
ManpowerGroup Inc. Price, Consensus and EPS Surprise | ManpowerGroup Inc. Quote
Balance Sheet and Cash Flow
ManpowerGroup exited the first quarter with cash and cash equivalents’ balance of $566.3 million compared with $591.9 million in the prior quarter. Long-term debt at the end of the quarter was $1 billion compared with $1.03 billion in the preceding quarter.
The company generated $101.9 million of cash from operating activities and spent $10 million on capex in the quarter. It repurchased 1.2 million shares for $101 million.
Second-Quarter Outlook
ManpowerGroup anticipates earnings per share in the range of $1.96-$2.04. The midpoint of this guided range ($2.00) is below the Zacks Consensus Estimate of $2.01. The guidance includes a negative impact of 10 cents from foreign currency.
The company’s revenue guidance is between 1% decline and 1% growth on a constant-currency basis. Further, the company anticipates its income tax rate in the second quarter to be around 35.5%.
Zacks Rank & Upcoming Releases
Currently, ManpowerGroupcarries a Zacks Rank #3 (Hold). You can see the complete list of today’s Zacks #1 Rank (Strong Buy) stocks here.
Investors interested in the broader Zacks Business Services sector are awaiting first-quarter 2019 earnings reports of key players like Avis Budget (NASDAQ:CAR) , Clean Harbors (NYSE:CLH) and IQVIA Holdings (NYSE:IQV) . All of them are slated to report on May 1.
Biggest Tech Breakthrough in a Generation
Be among the early investors in the new type of device that experts say could impact society as much as the discovery of electricity. Current technology will soon be outdated and replaced by these new devices. In the process, it’s expected to create 22 million jobs and generate $12.3 trillion in activity.
A select few stocks could skyrocket the most as rollout accelerates for this new tech. Early investors could see gains similar to buying Microsoft (NASDAQ:MSFT) in the 1990s. Zacks’ just-released special report reveals 7 stocks to watch. The report is only available for a limited time.
See 7 breakthrough stocks now>>
Avis Budget Group, Inc. (CAR): Free Stock Analysis Report
ManpowerGroup Inc. (MAN): Free Stock Analysis Report
Clean Harbors, Inc. (CLH): Free Stock Analysis Report
IQVIA Holdings Inc. (IQV): Free Stock Analysis Report
Original post