With the precious metals' fundamentals so well and widely covered at last, this report looks solely at the technical view, which is simplified and based only on my favourite indicators over these past 34 years.
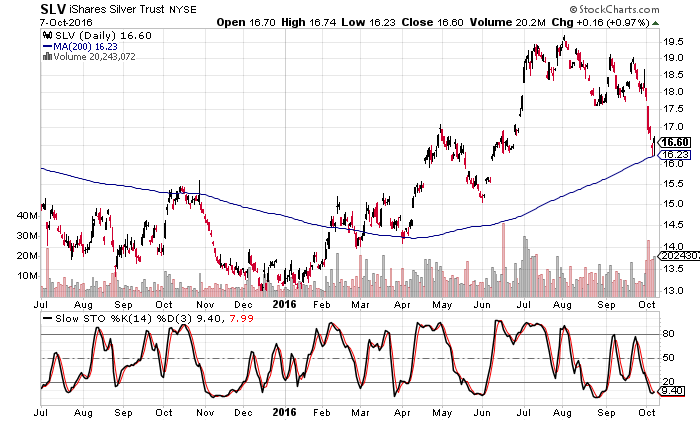
The daily iShares Silver (NYSE:SLV) chart, below, dates from July 1, 2015 - present, and includes its slow stochastic (momentum indicator beneath chart), as well as the 200-day moving average.
STOCHASTIC MOMENTUM INDICATOR
Assuming the price low was seen last week (which ended with a $0.16 advance on the day of the low, Friday), there presently exists a massive positive divergence versus the August low.
200-DAY MOVING AVERAGE
Friday's low nailed the 200-day MA to the penny at $16.23, before rallying to $16.74 and subsequently closing at $16.60.
PERCENT RETRACEMENT
This week's low represents a nearly-precise 50% retracement of this year's entire rally.
ELLIOTT WAVE COUNT and FORMATION
Shoulder-head-shoulder: The left shoulder begins in September 2015, with the head forming at year end. The right shoulder forms during the March/April 2016 period.
EWT pattern: Wave-1 of the resumed bull market concluded at the very end of April (2016), with wave-2 ending on the 1st day of June.
Wave-1 of a major advance terminated at the August peak, from which point we may have already concluded an a-b-c pattern, where wave-a ended at the end of that month, while wave-b ended on the very last day of September (the quarter-end traders' book closings). (Wave-b took the form of an a-b-c-d-e contracting triangle.)
Typically, then, wave-c might well have already ended with a 5-wave pattern just before noon Friday, as I believe.
Therefore, we are on the cusp of a massive Wave-3 of 3 advance that could take silver to dramatically higher levels much sooner than what even bulls may believe likely.
What is important is the pattern and the above indicators' implications; just how fast things happen is of lesser importance. However, making sure that your metal is deliverable IS important.
At the August peak, a silver bull would have gotten on his/her knees for today's price coupled with the above combination of technical indicators.
This certainly qualifies among my most confident silver forecasts EVER!

Whenever a significant trend begins, the major players know it. Sovereigns, hedge funds, etc. Once, I always wondered, "Who is the guy who sold at such cheap levels after the new trend had begun?".
I could give a lengthy academic explanation of both "how" and "why," but it is easier for me to simply and summarily state what my father used to say to me (with a don't-waste-your-time-attitude):
"Don't think about it; just do what you've got to do."
Rates are negative, stocks have been getting trashed around the world (approaching almost 2 years now), banks look 2008-ish (Deutsche Bank (NYSE:DB) looks like Lehman), and there might not be any available silver by the end of 2017!
Buy whatever precious metal you like, but just don't bother looking elsewhere. As for the asset class itself, stick to silver. Its leverage dwarfs anything else.
