Get 40% Off
👀 👁 🧿 All eyes on Biogen, up +4,56% after posting earnings. Our AI picked it in March 2024.
Which stocks will surge next?
Unlock AI-picked Stocks

Major Asset Classes: April 2021 Risk Review

Published 05/05/2021, 07:49 AM
Updated 07/09/2023, 06:31 AM

Today’s post rolls out the inaugural Risk Review column for the major asset classes, a monthly update that’s the companion piece to the monthly performance report and risk-premia estimates. Readers can use this trio for a quick summary of historical and expected return and how that compares with several measures of risk.

Risk analysis is a broad and deep subject and so this monthly update will be no one’s idea of a comprehensive treatment. Rather, the goal is to offer a comparison of the major asset classes in one fell swoop for a range of metrics—a comparison that’s not exactly ubiquitous among the usual suspects for financial news.

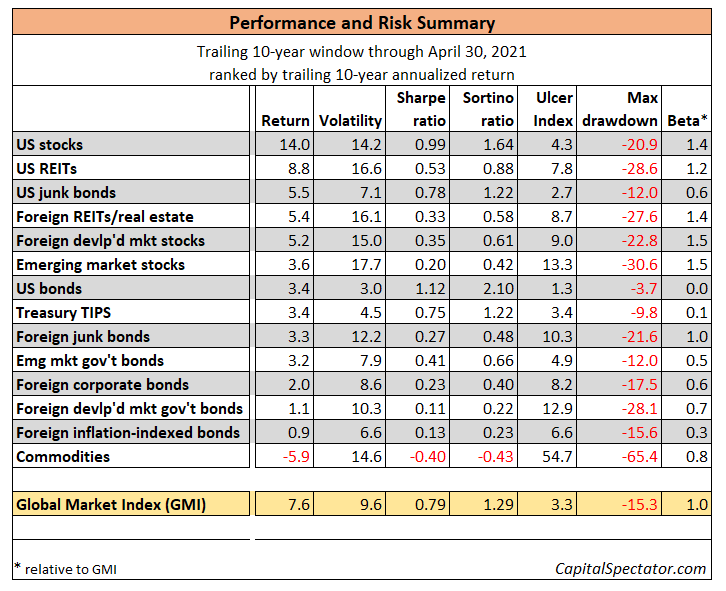
With that in mind, the table below highlights several flavors of risk for the trailing 10-year window through the end of last month (Apr. 30, 2021). For perspective on how risk stacks up relative to performance, the assets are ranked by trailing 10-year annualized return.

For the underlying indexes that represent the asset classes, you can refer to the table in the performance report post referenced above.

Performance & Risk Summary

For a bit of historical context on how risk has evolved, a regular feature in this update will be a chart of rolling 3-year annualized Sharpe ratio for US stocks (Russell 3000 Index), US bonds (Bloomberg Aggregate Bond Index) and the Global Market Index (GMI), an unmanaged, market-value-weighted portfolio that holds all the major asset classes (except cash) and represents a theoretical benchmark of the “optimal” portfolio.
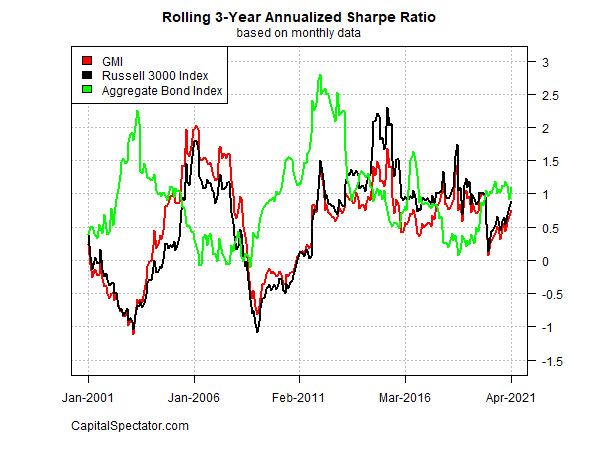
Rolling 3 Year Annualized Sharpe Ratio

For reference, here are brief definitions of each risk metric:

3rd party Ad. Not an offer or recommendation by Investing.com. See disclosure here or remove ads .
  • Volatility: annualized standard deviation of monthly return
  • Sharpe ratio: ratio of monthly returns/monthly volatility (risk-free rate is assumed to be zero)
  • Sortino ratio: excess performance of downside semi-variance (assuming 0% threshold target)
  • Ulcer Index: duration of drawdowns by selecting negative return for each period below the previous peak or high water mark
  • Maximum Drawdown: the deepest peak-to-trough decline
  • Beta: measure of volatility relative to an index (in this case GMI)

Latest comments

Risk Disclosure: Trading in financial instruments and/or cryptocurrencies involves high risks including the risk of losing some, or all, of your investment amount, and may not be suitable for all investors. Prices of cryptocurrencies are extremely volatile and may be affected by external factors such as financial, regulatory or political events. Trading on margin increases the financial risks.
Before deciding to trade in financial instrument or cryptocurrencies you should be fully informed of the risks and costs associated with trading the financial markets, carefully consider your investment objectives, level of experience, and risk appetite, and seek professional advice where needed.
Fusion Media would like to remind you that the data contained in this website is not necessarily real-time nor accurate. The data and prices on the website are not necessarily provided by any market or exchange, but may be provided by market makers, and so prices may not be accurate and may differ from the actual price at any given market, meaning prices are indicative and not appropriate for trading purposes. Fusion Media and any provider of the data contained in this website will not accept liability for any loss or damage as a result of your trading, or your reliance on the information contained within this website.
It is prohibited to use, store, reproduce, display, modify, transmit or distribute the data contained in this website without the explicit prior written permission of Fusion Media and/or the data provider. All intellectual property rights are reserved by the providers and/or the exchange providing the data contained in this website.
Fusion Media may be compensated by the advertisers that appear on the website, based on your interaction with the advertisements or advertisers.
© 2007-2024 - Fusion Media Limited. All Rights Reserved.