- All Instrument Types
- Indices
- Equities
- ETFs
- Funds
- Commodities
- Currencies
- Crypto
- Bonds
- Certificates
Please try another search

See the stocks on our ProPicks radar. These strategies gained 19.7% year-to-date.
Every Major Asset Class Ended March Lower. Is It Over?

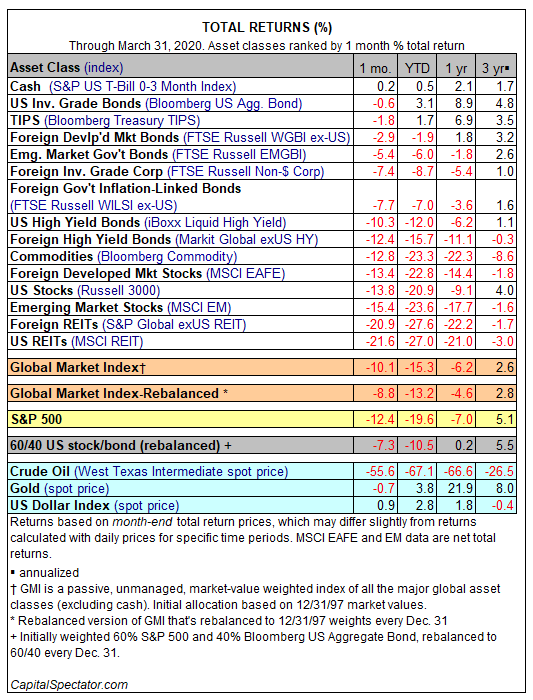
The value of cash as an asset class had its moment in the sun in March as coronavirus blowback cut deeply into markets around the world. Posting the only gain among the major asset classes in last month’s tsunami of losses, the S&P US T-Bill 0-3 Month Index exemplified its role as a port in the storm with a 0.2% gain. Par for the course for cash returns of late, but oh-so-welcome in an otherwise miserable month for risk assets.
Beyond cash, red ink infected every corner of the major asset classes, ranging from the relatively mild 0.6% loss in March for US investment grade bonds (Bloomberg US Aggregate Bond Index) to the deep 21.6 crash in US real estate investment trusts (MSCI REIT Index)–the sector’s biggest monthly decline since the 2008-2009 financial crisis.
In the wake of last month’s thrashing, losses have spread to longer-term windows. For trailing one-year results, for instance, only cash and a select group of bonds are posting gains.
US stocks certainly took a hit last month: the Russell 3000 Index tumbled 13.8% in March—its deepest monthly slide in a dozen years.

The main question investors are asking: Is it over? Don’t count on it, warns DoubleLine Capital Chief Investment Officer Jeffrey Gundlach. “I think we’re going to get something that resembles that panicky feeling again during the month of April,” he predicts.
As for bottom-fishing for beaten-down assets, Oaktree Capital co-chairman Howard Marks says “things have gotten cheap enough” to start nibbling. “I personally think that securities are low enough to buy a little. Somebody said to me, ‘is this the time to buy?’ I say no, ‘this is a time to buy,’” emphasizing that with uncertainty surging a strong dose of time diversification (don’t concentrate purchases on any one date) is warranted for the simple reason that no one knows where the bottom is.
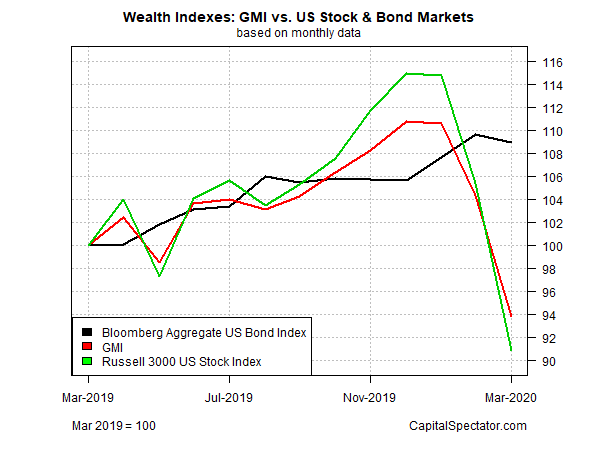
There was no sign of a bottom last month for the Global Markets Index (GMI), an unmanaged benchmark (maintained by CapitalSpectator.com) that holds all the major asset classes (except cash) in market-value weights. GMI fell a hefty 10.1% in March—the benchmark’s biggest monthly decline since 2008.
For the trailing one-year return, GMI is down 6.2%, a modestly softer decline vs. US stocks, which fell 9.1% over the past year via the Russell 3000 Index. US bonds, by comparison, are up 8.9% for the year through last month’s close, based on the Bloomberg Aggregate Bond Index.

Related Articles

The big story of yesterday was the disappointing results from the biggest European company, ASML Holding (AS:ASML) (NASDAQ:{{39320|ASML} }), which sells equipment to chipmakers...

The only aspect of consistency in the market’s outlook for rate cuts lately has been pushing the expected date forward. Recent history falls in line with this trend and...

Gold Holds Above Historical Highs as Middle East Tensions ContinueThe gold (XAU) price remains elevated as traders exercise caution due to escalating tensions in the Middle...
Are you sure you want to block %USER_NAME%?
By doing so, you and %USER_NAME% will not be able to see any of each other's Investing.com's posts.
%USER_NAME% was successfully added to your Block List
Since you’ve just unblocked this person, you must wait 48 hours before renewing the block.
I feel that this comment is:
Thank You!
Your report has been sent to our moderators for review


Add a Comment
We encourage you to use comments to engage with other users, share your perspective and ask questions of authors and each other. However, in order to maintain the high level of discourse we’ve all come to value and expect, please keep the following criteria in mind:
Enrich the conversation, don’t trash it.
Stay focused and on track. Only post material that’s relevant to the topic being discussed.
Be respectful. Even negative opinions can be framed positively and diplomatically. Avoid profanity, slander or personal attacks directed at an author or another user. Racism, sexism and other forms of discrimination will not be tolerated.
Perpetrators of spam or abuse will be deleted from the site and prohibited from future registration at Investing.com’s discretion.