After the final ballots had been cast, counting got underway leading to the pro-EU centrist candidate, Emmanuel Macron declaring a victory in the French presidential elections as widely expected.
Macron won by a clear majority with over 65% of votes in his favor compared to Le Pen's 35%. The verdict sent the common currency hurtling towards 1.1000, to post a session high of 1.1020 before giving up some of the gains. The market reaction was muted considering that a Macron-victory was pricedin.
The economic calendar is light today with only German factory orders and the Sentix investor confidence coming up during the European trading session followed by Canada's housing starts later in the day.
EUR/USD intraday analysis

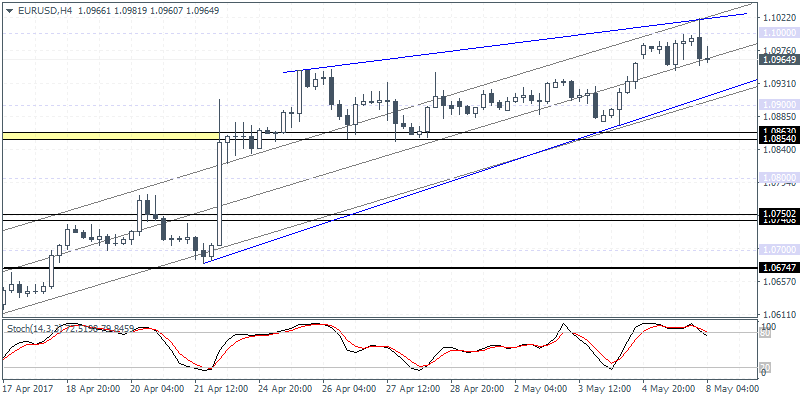
EUR/USD (1.0964): EUR/USD has posted a fresh 6-month high on Monday's open with price briefly breaking past 1.1000 handle. The move was widely expected and the markets had already priced in a Macron-victory. The MSCI France ETF closed on Friday at fresh 2-year highs in anticipation of the result.
From a technical outlook, EUR/USD is likely to see some downside prevailing as focus shifts back to monetary policy and interest rate outlook. Technically, the strong rally off 1.0700 is indicative that a possible pullback could be in the making. Watch for a close below 1.0950 followed by a bearish breakout from the rising wedge pattern. This will signal a move towards 1.0863 - 1.0850 support level and eventually to 10750 - 1.0740 level.
USD/JPY intraday analysis

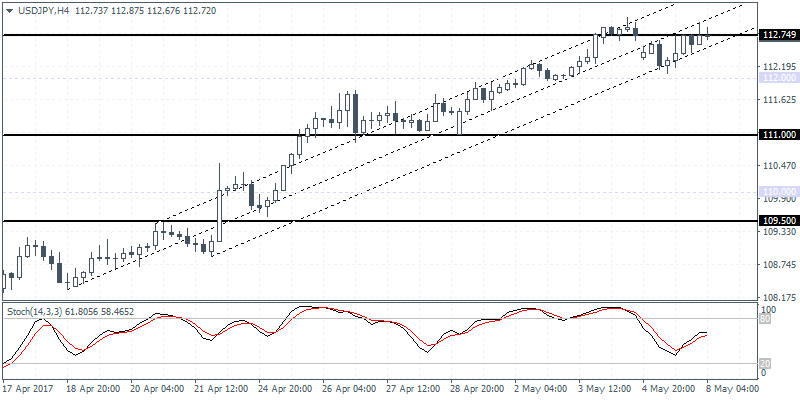
USD/JPY (112.72):The USD/JPY is seen struggling to push higher above 112.50 with the daily chart signaling a strong hidden bearish divergence. Failure to break out above 112.50 could mean that USD/JPY will be looking a short-term correction in prices, potentially towards 109.50.
On the 4-hour chart, the current rally saw price testing 112.749 which marks the unfilled gap from last week, A decline from here could push USD/JPY down towards 111.00 support level initially followed by a test of support near 109.50.
XAU/USD intraday analysis

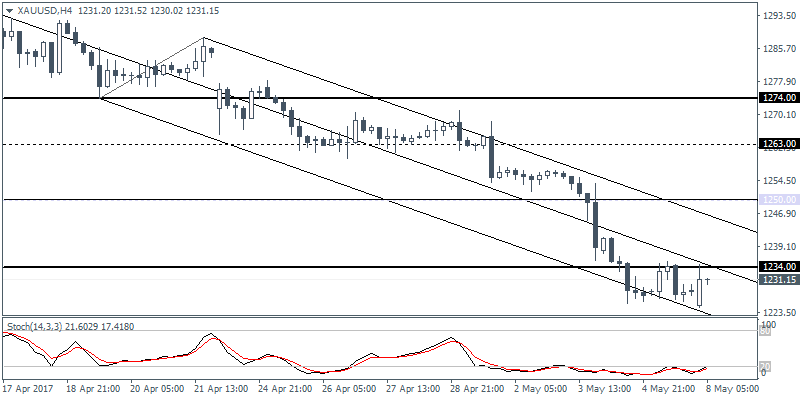
XAU/USD (1231.15): Gold closed in a doji on Friday with an inside bar. This potentially signals a near-term breakout in the making. Following the breakout from 1250.00 and the rising wedge pattern on the daily chart, we can expect to see some pullback in the near term where resistance could be established at this level.
Such a move could potentially keep gold prices subdued towards testing the lower support at 1200.00. The daily Stochastics has printed a hidden bullish divergence supporting this view. On the 4-hour chart, look for an upside gain in prices above 1234.00 which will confirm the move towards 1250.00.
