Get 40% Off
🚨 Volatile Markets? Find Hidden Gems for Serious OutperformanceFind Stocks Now

Lucky 13

Published 04/15/2021, 12:48 AM
Updated 07/09/2023, 06:31 AM

On Apr. 13, 2021, the SPDR® S&P 500 (NYSE:SPY)) closed above its opening price for the 13th consecutive session. That has never happened in the 28-year history of the exchange-traded fund.
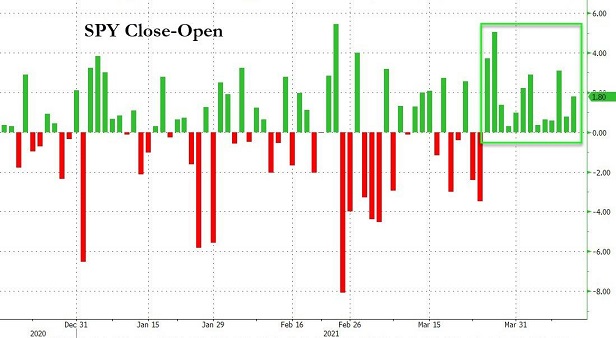
SPY Close-Open Chart

Without question, enthusiasm for stocks is feverish. But is it rational?

Everyone agrees that the tech stock bubble of 2000 was entirely irrational. Historians even associate the insanity with the term “irrational exuberance.”

Yet few folks seem to have an issue with record high stock valuations in 2021. The market cap for growth stocks relative to GDP is actually higher than it was at the turn of the century.
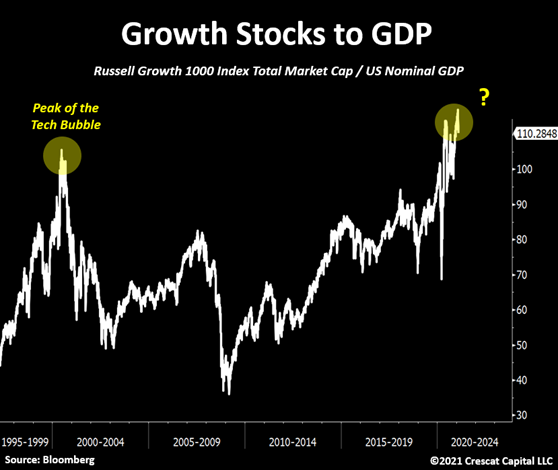
Growth Stocks To GDP Chart

There’s virtually nothing that today’s investor isn’t willing to overlook. Threat of the highest corporate tax rates in the world? Meh.
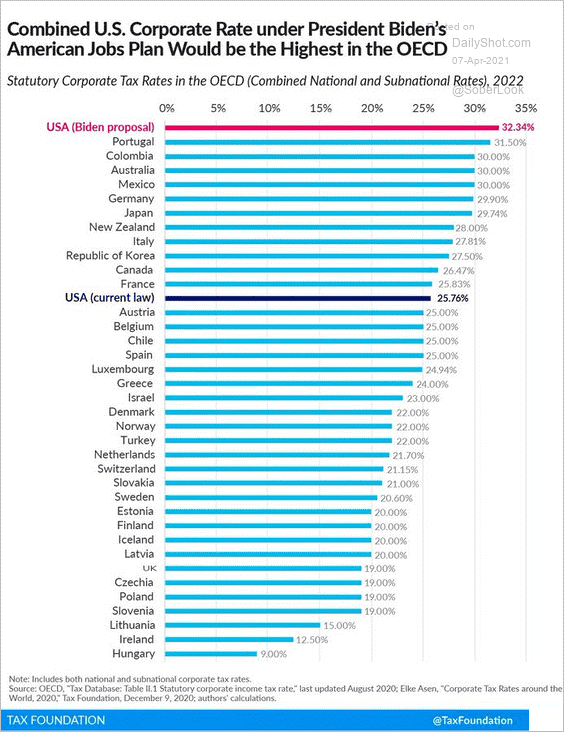
Corporate Tax Under President Biden

The possibility that inflation will dent economic well-being? Yawn.
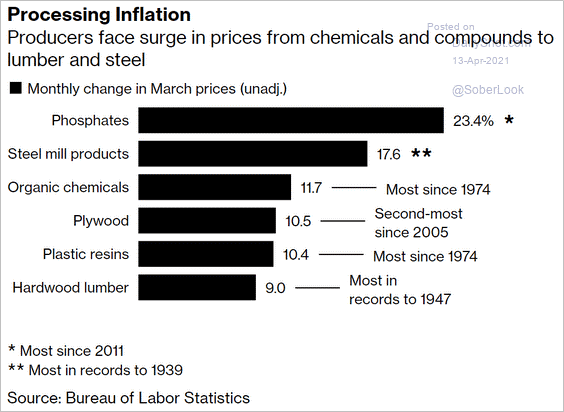
Processing Inflation

A 13-year high for the home price-to-rent ratio? Well, it’s still not as crazy as it was at the height of the housing bubble.
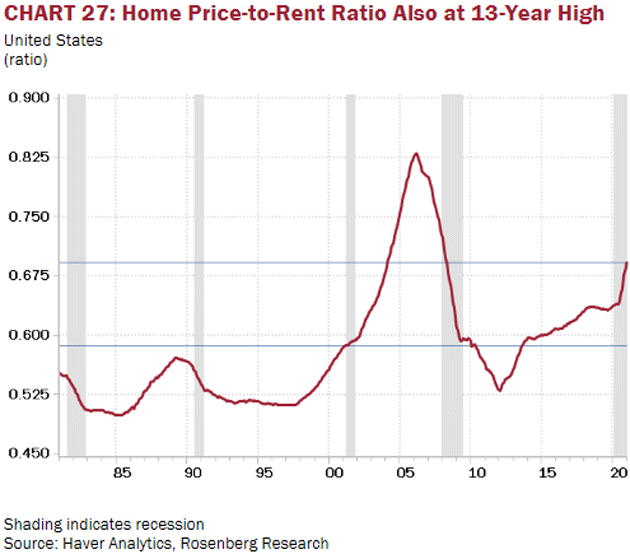
Home Price-To-Rent Ratio Chart

Perhaps common sense is overrated. Or perhaps the fear of missing out (FOMO) is a more powerful investing force than reversion to the mean.

Speaking of the inevitability of mean reversion, stock prices have not revisited their mean valuation levels in more than a decade. In and of itself, this is surprising.

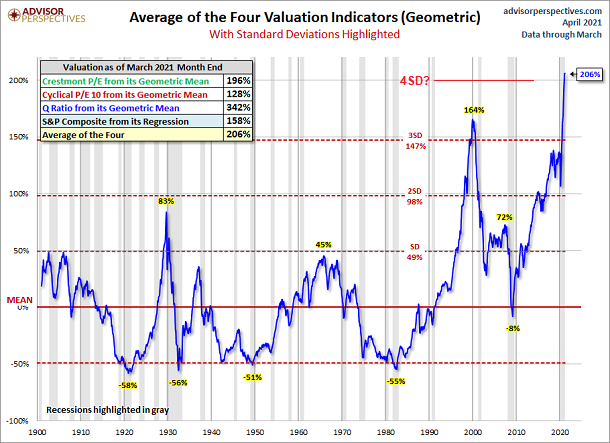
Now consider that stock price overvaluation is four standard deviations above average (mean) valuation levels. Stock price overvaluation came close to two standard deviations in 1929; it briefly surpassed three sigma levels in 2000.

But four sigma? Well, we may have crossed the Rubicon. At four standard deviations above a geometric mean, valuations are at levels that might occur once in 126 years.
3rd party Ad. Not an offer or recommendation by Investing.com. See disclosure here or remove ads .

Average Of The Four Valuation Indicators

Latest comments

Permanent divergence? … Financial science fiction - speculative utopia? *insert theme to Twilight Zone
Risk Disclosure: Trading in financial instruments and/or cryptocurrencies involves high risks including the risk of losing some, or all, of your investment amount, and may not be suitable for all investors. Prices of cryptocurrencies are extremely volatile and may be affected by external factors such as financial, regulatory or political events. Trading on margin increases the financial risks.
Before deciding to trade in financial instrument or cryptocurrencies you should be fully informed of the risks and costs associated with trading the financial markets, carefully consider your investment objectives, level of experience, and risk appetite, and seek professional advice where needed.
Fusion Media would like to remind you that the data contained in this website is not necessarily real-time nor accurate. The data and prices on the website are not necessarily provided by any market or exchange, but may be provided by market makers, and so prices may not be accurate and may differ from the actual price at any given market, meaning prices are indicative and not appropriate for trading purposes. Fusion Media and any provider of the data contained in this website will not accept liability for any loss or damage as a result of your trading, or your reliance on the information contained within this website.
It is prohibited to use, store, reproduce, display, modify, transmit or distribute the data contained in this website without the explicit prior written permission of Fusion Media and/or the data provider. All intellectual property rights are reserved by the providers and/or the exchange providing the data contained in this website.
Fusion Media may be compensated by the advertisers that appear on the website, based on your interaction with the advertisements or advertisers.
© 2007-2024 - Fusion Media Limited. All Rights Reserved.