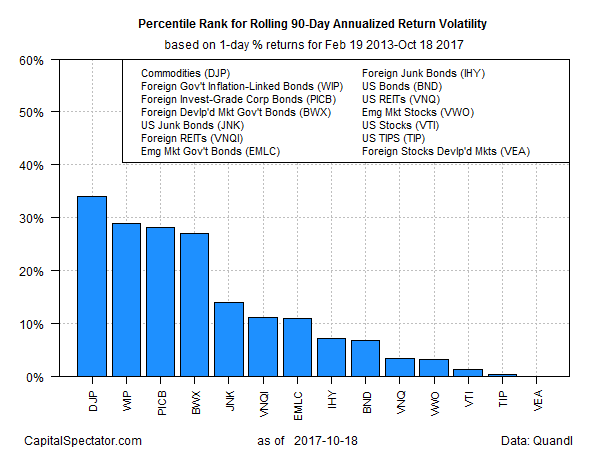
A rising number of investors are anxious about the “bull market in everything”, but the markets are calm, based on rolling 90-day volatility (standard deviation). It may be the calm before the storm, although research on volatility clustering suggests that the tranquil times can roll on for longer than expected. The tide will turn eventually, of course, and perhaps soon, but the rear-view mirror at the moment shows that the landscape is unusually serene across the board for the major asset classes in recent history, based on a set of exchange-traded products via rolling 90-day standard deviation of one-day percentage returns.
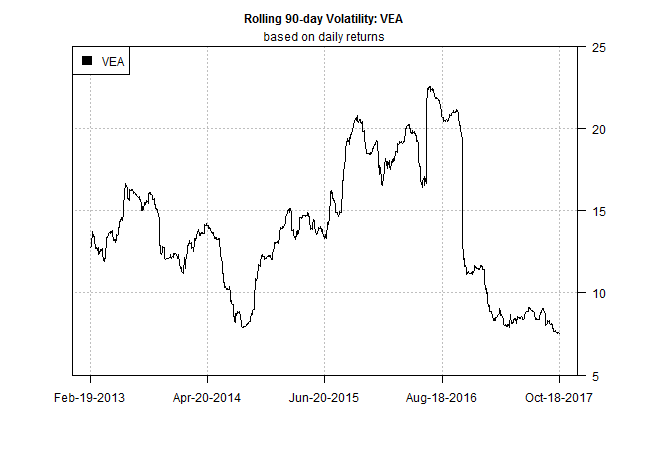
Ranking markets by percentile rank for the historical period since early 2013 reveals that foreign stocks in developed markets are the low-vol leader. Based on that window, Vanguard FTSE Developed Markets' (NYSE:VEA) 90-day vol is at its lowest point through yesterday’s close (Oct. 18) – just a hair above the zero percentile rank.

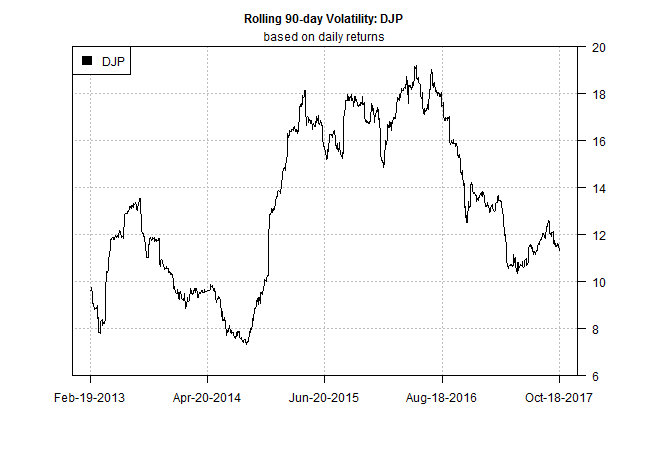
At the opposite extreme: broadly defined commodities. The 90-day vol rank for iPath Bloomberg Commodity Total Return Exp 12 June 2036 (NYSE:DJP) is currently at the 34th percentile. That’s relatively high, compared with the rest of the field, but by the ETN’s history over the last several year’s it’s clear that trading activity has become rather peaceful of late.
For additional context, let’s focus on the rolling volatility for a handful of funds, starting with the calmest portfolio in the bunch: Vanguard FTSE Developed Markets (VEA). As the chart below shows, volatility for the fund has collapsed over the past year.

Commodities, on the other hand, are the high-vol leader these days via iPath Bloomberg Commodity (DJP). That’s not surprising, although what passes for volatility in this corner has fallen sharply in recent history.

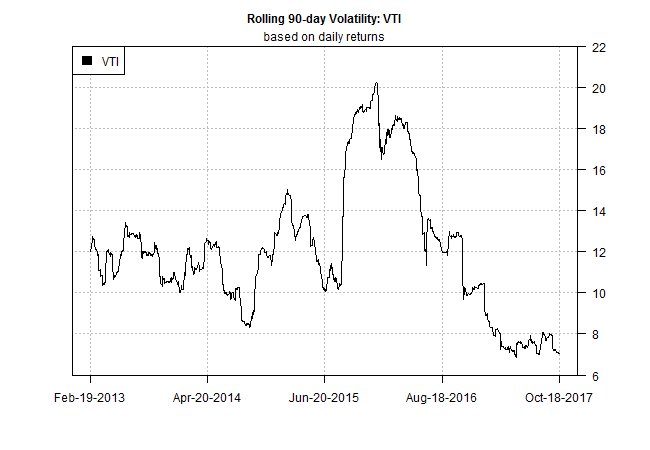
Finally, let’s profile the US stock market’s vol history of late. Here, too, the main event is a dramatic slide in volatility, based on Vanguard Total Stock Market (NYSE:VTI). The fund’s trailing 90-day vol isn’t at its lowest level in recent years, but it’s close: the current vol reading is roughly at the 1% percentile rank since 2013.

What’s the message in the low-vol landscape that prevails in just about everything? There’s nothing new under the sun, but now’s a good time to roll out the standard observations. First, volatility cycles through time. High vol is inevitably followed by low vol, and vice versa. That’s a reminder that the low-vol environment of late will one day give way to high vol, which implies falling prices.
But volatility clustering is also an empirical fact when it comes to vol. Low-vol and high-vol regimes, in other words, have a habit of sticking around. The challenge, as always, is deciding when a given regime state has overstayed its welcome.
What might signal the end of the current low-vol regime? “Usually we need something to go wrong on a national or global scale to disrupt markets,” writes Yale Professor Roger Ibbotson this week. By that standard, change is surely coming… eventually.
