
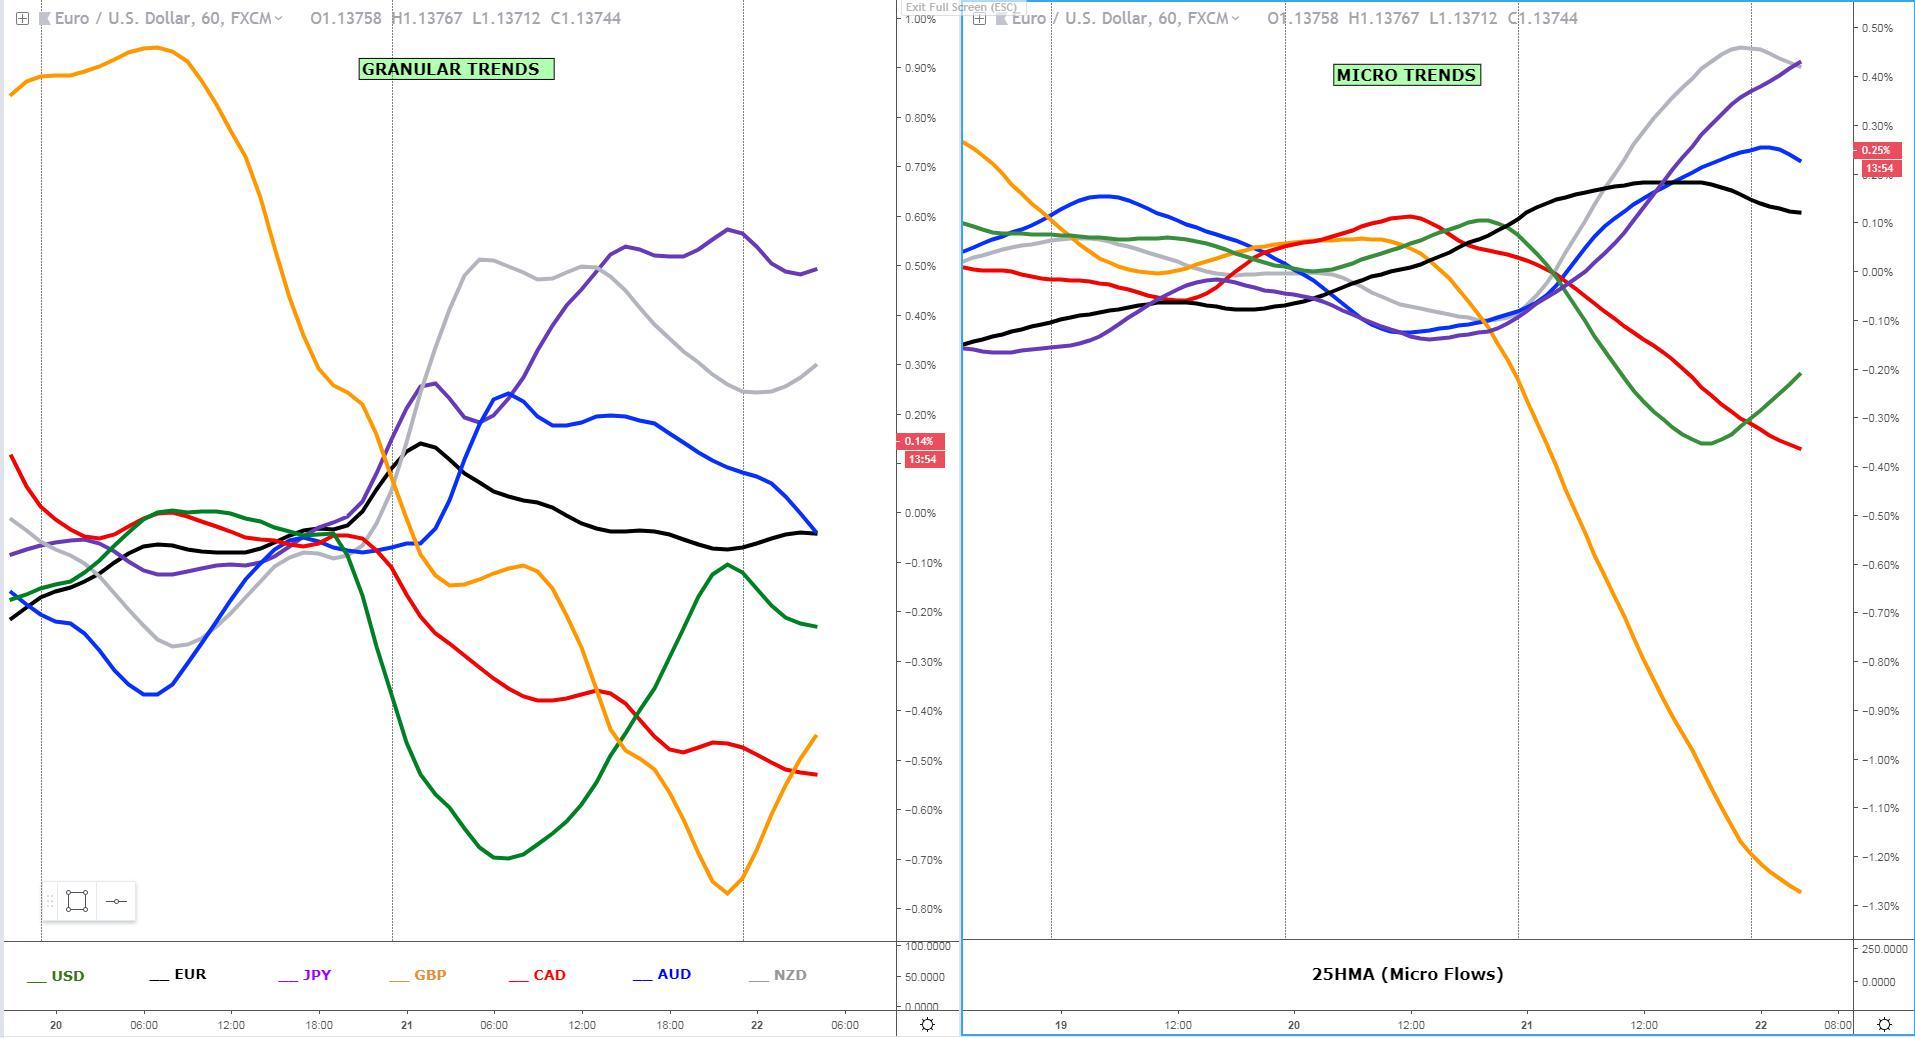
To start with, it's worth pointing out that even if the low volume environment is suppressing directional biases from a higher timeframe perspective, it doesn't mean there is a deficit of opportunities if you know where to look for. For instance, ever since the FOMC meeting, there has been two currencies (GBP, CAD) which have exhibited strong directional moves intraday as our currency meter shows. The same can not be said about the USD, as one of the key factors behind the attractiveness towards the currency, even after a clearly dovish FOMC, is that it continues to act as the pick of choice when it comes to carry trading (borrow low yielding currencies and play long high yielding). It is on the basis on this market dynamics of capitalizing on low vol through carry trades, coupled with overextended nature of the moves post FOMC, that led the euro to give back its gains. On the flip side, the JPY showed a more combative spirit amid the 'weak risk off' environment given the falls in US yields yet the rise in the DXY (equities higher as well). Somewhere in the middle, still showing signs of decent demand we find the Aussie and the Kiwi, backed by the recent economic data (Australian jobs, New Zealand Q4 GDP).
Key Narratives in Financial Markets
- A major rebound in the USD just one day after the surprisingly dovish Fed, essentially sending the currency back to about pre--Fed levels against the majority of peers. The recovery vindicates that macro directional movements in the Forex arena are almost non-existent, further reinforcing the notion to zero in on intraday flows to stay on the right side of the market.
- Central Banks’ policy divergences are nowhere to be found, and if on top of that we add the drag of the Brexit saga for another XX number of months, the commitment by real money accounts to promote regular buy or sell-side flows in a particular currency is almost null.
- Brexit news continue is a state of fluidity and uncertainty. After UK PM May’s pitch in Brussels, the EU seems willing to offer an unconditional extension until May 7th, which is significantly earlier than the June 30th date the UK government was seeking out. This extension is contingent to potentially be extended beyond if UK’s May Brexit deal is defeated for a 3rd time next week. Such an extension would be granted if the UK agrees to hold EU elections. Meanwhile, the DUP party is not backing UK’s May deal as it stands, which makes the prospects of the Brexit bill passing through parliament very slim. As a result, GBP is suffering.
Recent Economic Indicators and Events Ahead
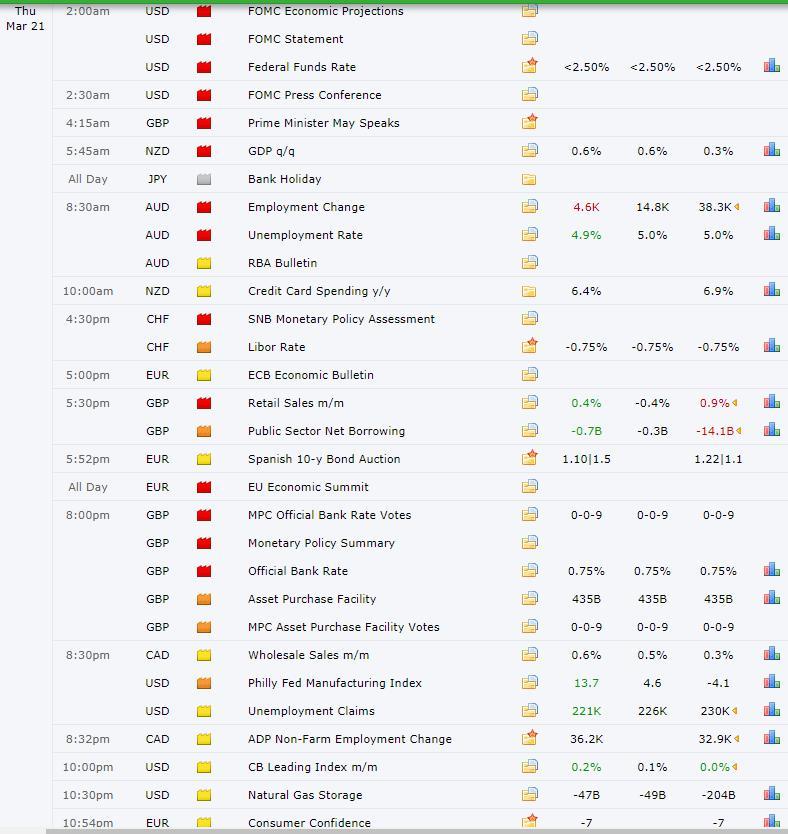
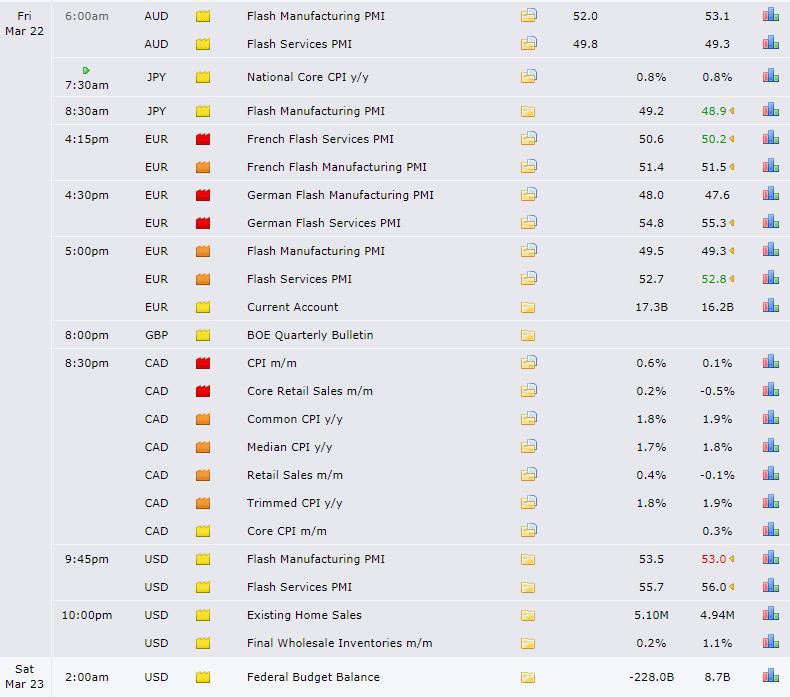
Source: Forexfactory
RORO - Risk On Risk Off Conditions
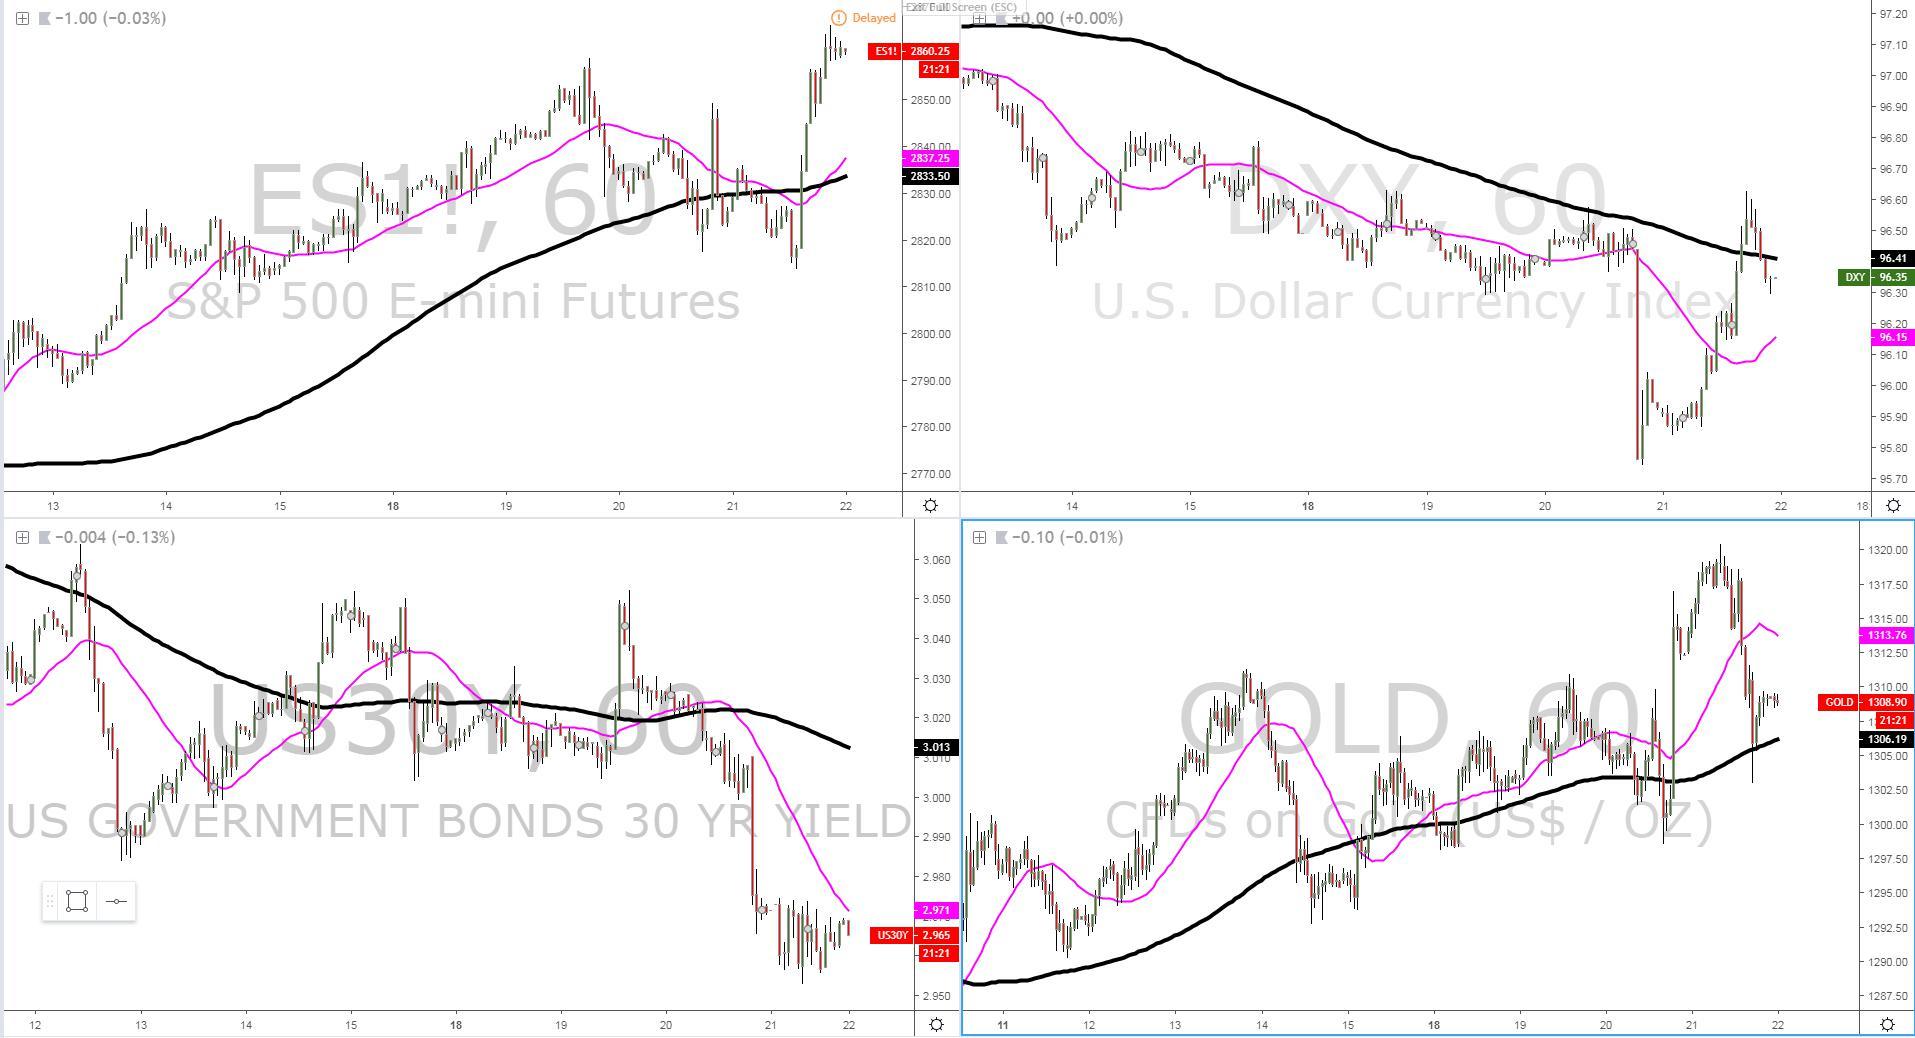
It didn’t take long for the USD weakness environment to reverse it course, even if the admission by the Fed to stay on the sidelines for the most part of 2019 and 2020 was a potential catalyst for the USD to endure a more sustainable period of supply flows. The issue, however, is that there is no clear winners in the currency space, in a world where Central Banks have permuted from a tentative tightening bias back in 2018 (BOE, BOC, FED, ECB) to one of the relatively high chances of deploying back most of its easing artillery to combat tighter financial conditions and promote the decade-long elusive mandate of creating real inflation. Amid this environment, the US economy is still the one that, in its own right, wins the least ugly contest. The low vol regime, which increases the appeal of carry trades (borrow low yielding currencies EUR, JPY and buy the higher yielding USD), makes it even harder to see a sustainable bearish trend in the US dollar. When it comes to the RORO (risk on, risk off) model, the environment has turned ‘weak risk off’ in the short term, as the magenta slope (microflows) based on the 25-HMA depicts. The S&P 500 is back making new highs for the year, but that is not being supported by further ‘risk on’ cues, as the combination of lower US yields and a higher US dollar makes the overall risk backdrop not ideal, even if the rapid and elongated rise in equities takes a bit of heat and pressure off ‘beta currencies’. Note, the RORO model and the link it has to gauge the performance of FX is contingent to individual economic data merits as well.
Summary: Intermarket Flows and Technical Analysis
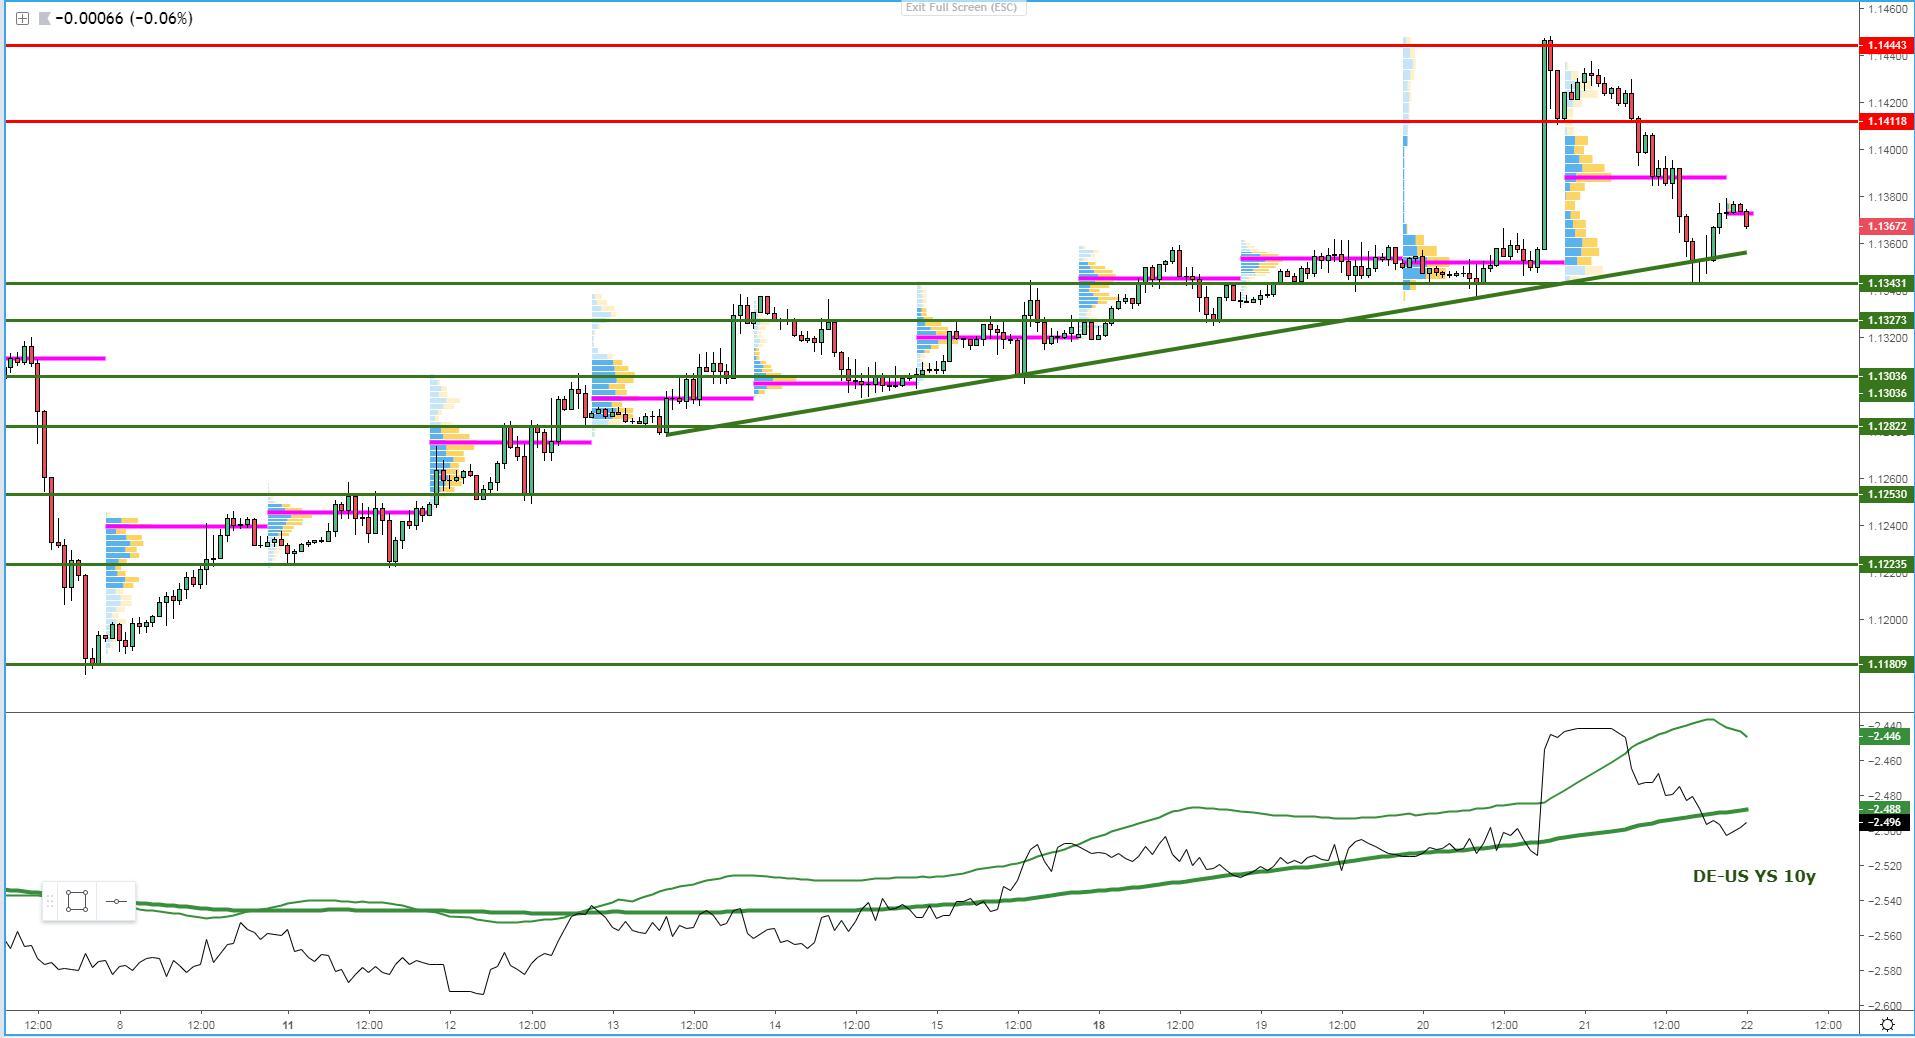
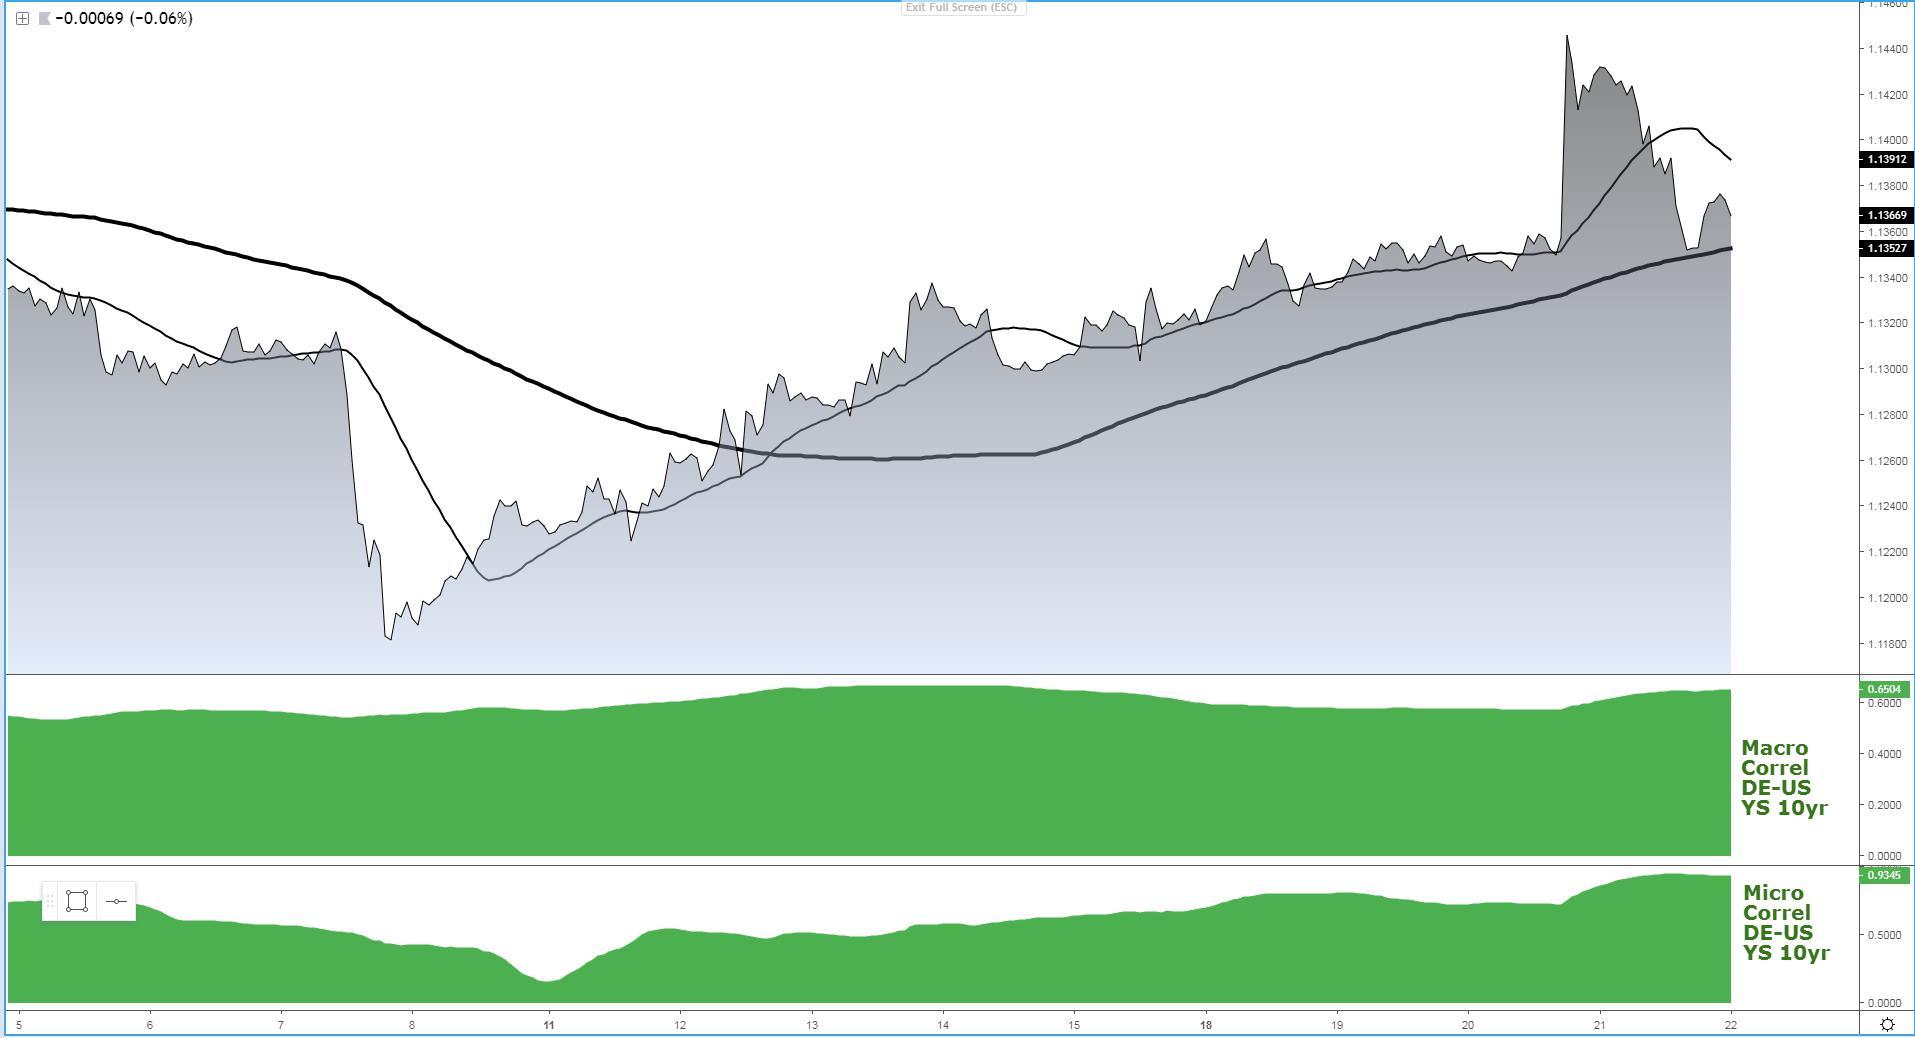
EUR/USD: Quick Round Trip From North To South
The FOMC-induced gains have evaporated amid low conviction to promote further USD selling. One of the key reasons hindering the upside potential can be found in the still relatively high appeal to jump back into the USD bandwagon in an environment of lower volatility, which makes the countries with a yield advantage, as in the case of the United States, an attractive destination amid the lack of FX alternatives. The U-turn type of movement since the FOMC found pockets of demand at 1.1340-45. The volume profile is characterized by a triple distribution down, with the NY close sub POC a negative development, even if the overall technical structure still lacks bearish credentials. Instead, until further price dynamics play out, the structure is best described as a wide 100p range, despite the clear refusal to find acceptance above 1.14 makes for a tentative 1.1340-1.14 range box as reference heading into Friday. Only an hourly close back above the $1.14 handle would start to suggest a potential resumption of the uptrend, which at this stage, given the abrupt retracement, is not the preferred case. Stay proactive analyzing technicals, especially in a market so choppy and directionless from a weekly standpoint as the euro vs USD is.
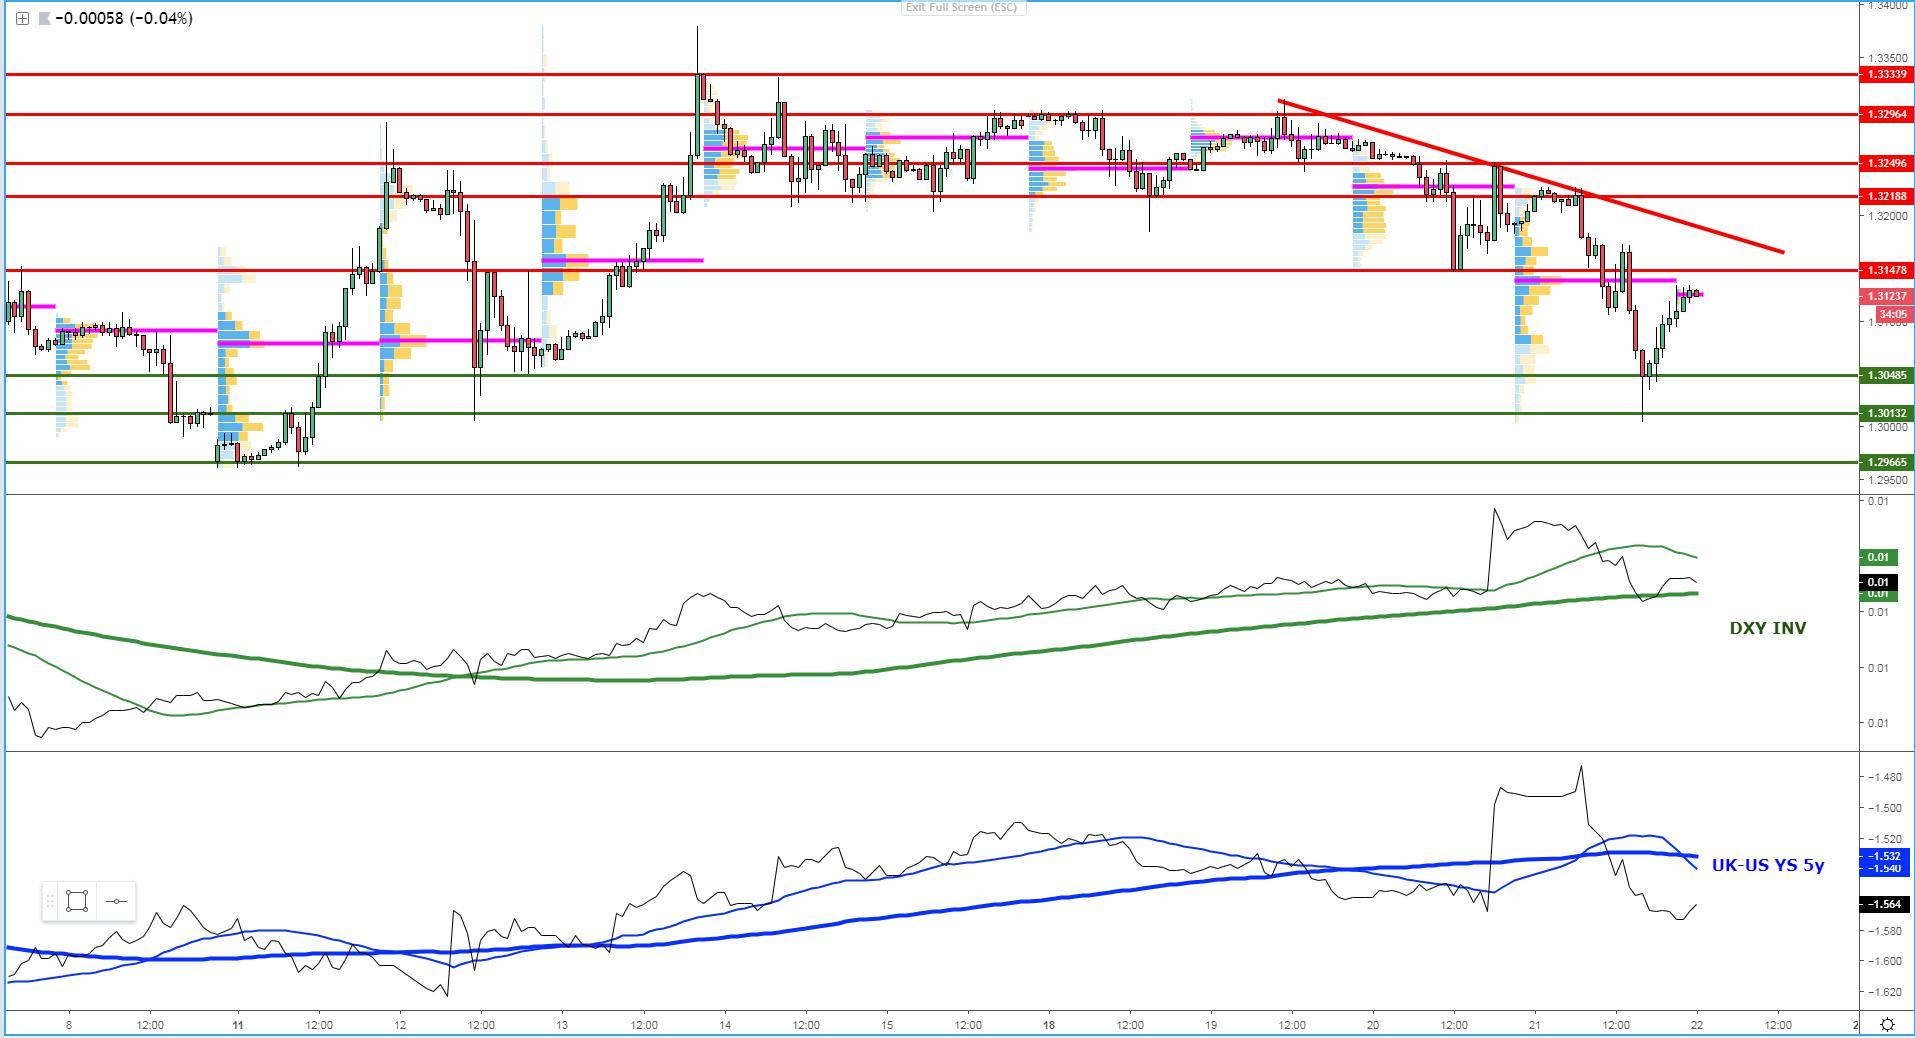
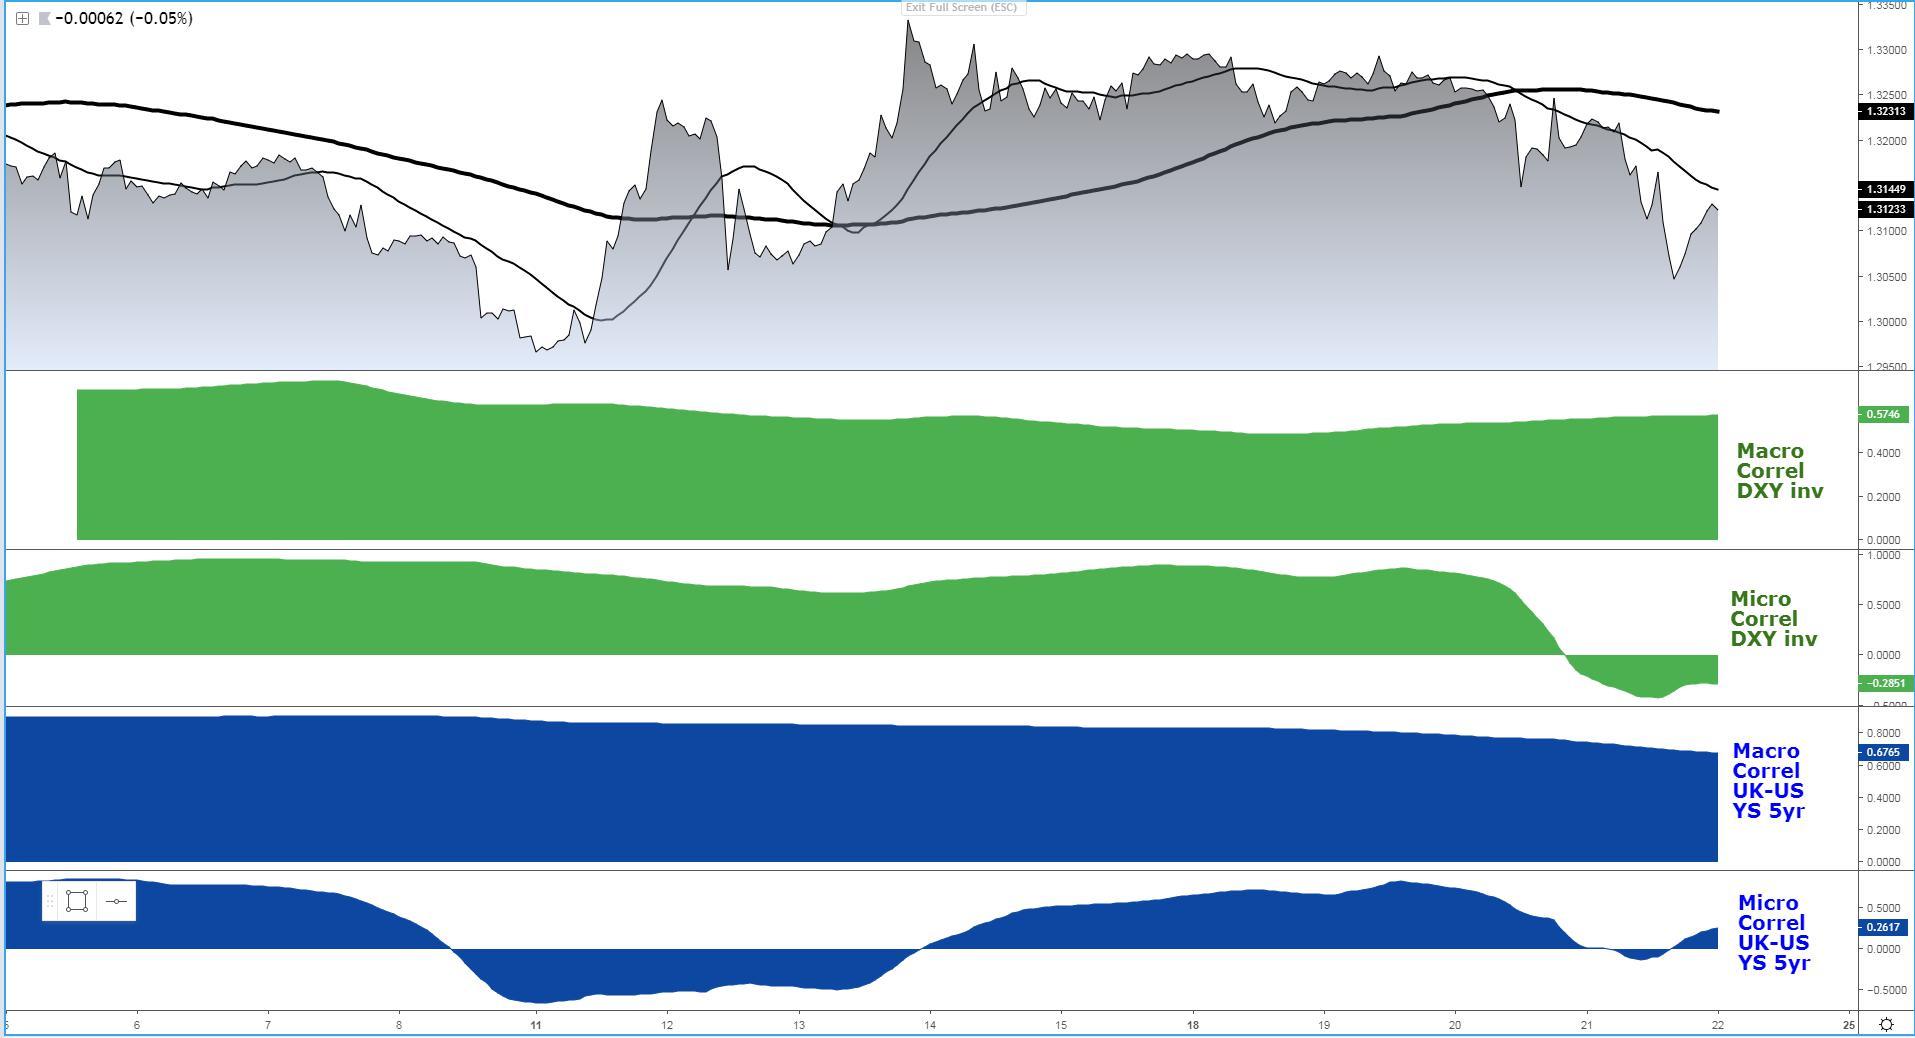
GBP/USD: Sellers Exploit Brexit Uncertainty
The UK government has failed to convey a message of stability in the Brexit saga amid the lack of consensus in the UK parliament to instead find itself in a real mess as it scrambles for an extension to remain a member of the EU. Whenever a country and a currency as the by-product goes through a period of uncertainty, that tends to be a recipe for disaster (read a precursor of deleveraging away from the country’s currency). The chart clearly portrays this level of unpredictability about Brexit, as the Sterling completes a round trip from the low 1.30s, up to the mid 1.33s only to be snapped back down again. That’s the lay of the land when trading the GBP these days, 0 complacency and be on top of every single Brexit development. Fortunately, if you follow the intraday intermarket analysis, the UK-US bond yield spread remains an excellent barometer to keep you on the right side of the market as a gauge of capital flows. The latest sell-side episode starts to have connotations of being climactic in nature as per the elongated extension to the downside towards 1.30, which implies a further continuation should be strongly conditioned to a deterioration in Brexit rather than technicals as the key driver. The latest decline allows us to draw a descending trendline that acts as a guidance of the developing bear trend. The multiple volume profile distribution saw a close sub the POC (Point Of Control), which reinforces the idea that buyers are far from being out of the woods unless they can regain the other side of the mentioned trendline. Overall, the risk towards further bearish tendencies intraday remains well and alive, even if it feels as though a prolonged ‘status quo’ in the Brexit pandemonium this Friday would cut it to find further demand on a retest of the lows 1.30s.
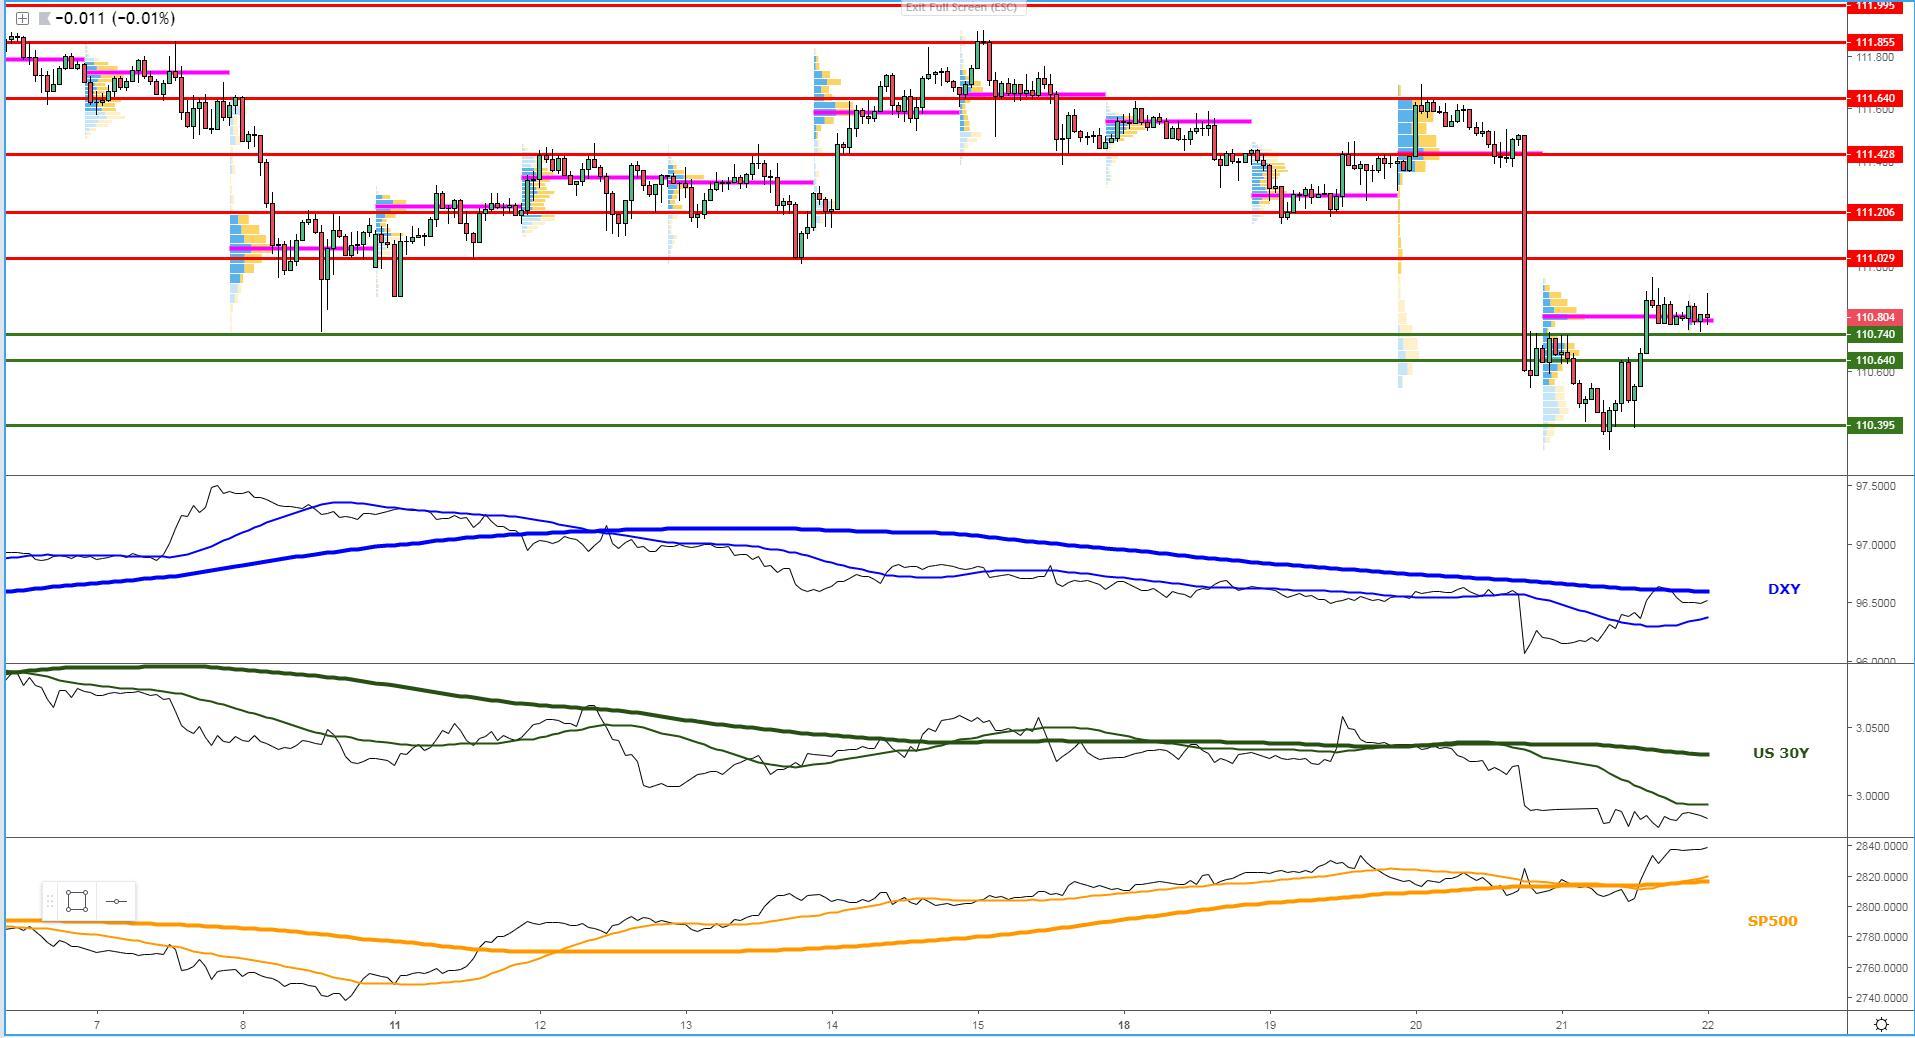
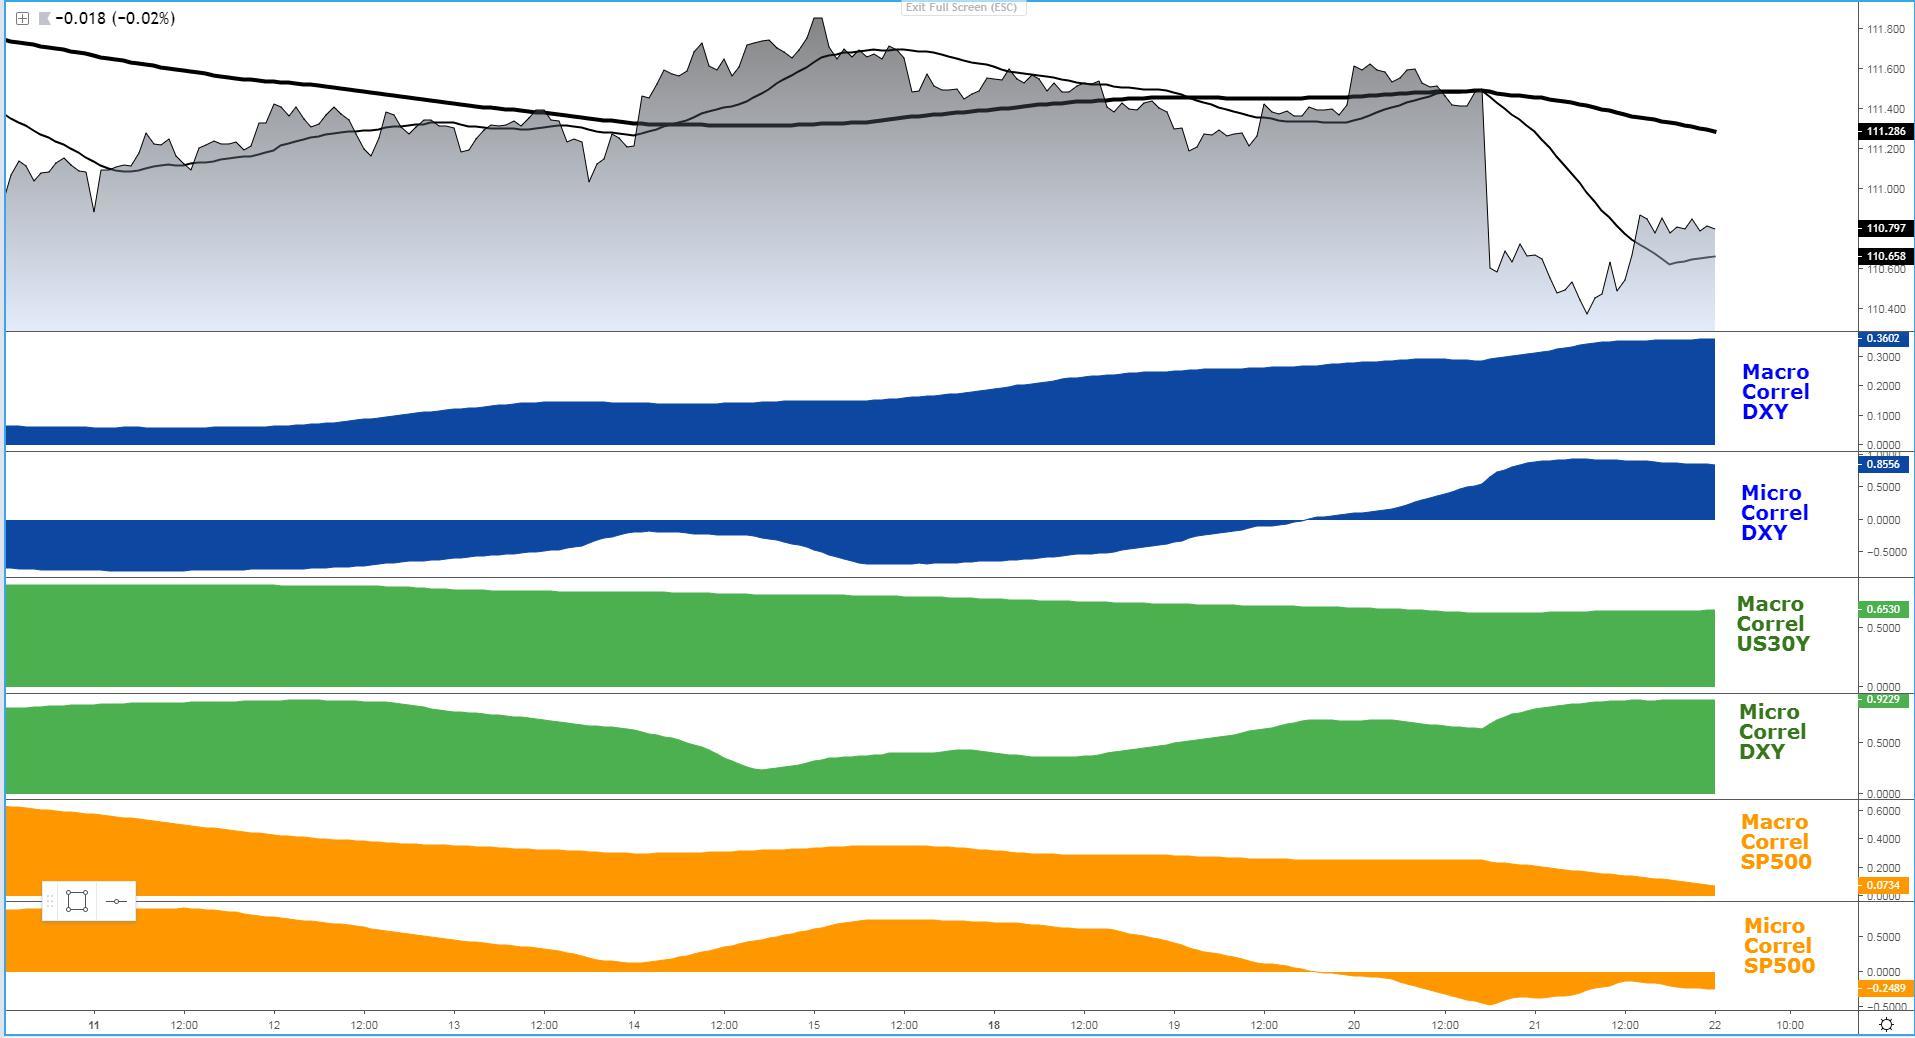
USD/JPY: Buyers Re-Emerge, Not Out Of The Woods
The pre-conditions for the pair to recover some ground off the lows were met, as the combination of higher equities/DXY alone counterbalanced the depressed state of US yields. From an intraday perspective (sub-hourly charts), the break of the previous swing high at 110.75 has allowed the formation of higher highs, which strengthens the mentality of buy on weakness as buyers found enough of an impulse to overwhelm sellers jumping in way too late in the game. As I mentioned yesterday, whenever we have the rubber band so overstretched (analogy for price extension), unless you have the interest to get involved in very short-term intraday movements, you run a high risk of getting into less than ideal risk-reward prospects. The volume profile formation in the last 24h supports the notion of further buying on dips given the P shape formation with acceptance near the highs of the day. The next pockets of liquidity where buyers and sellers will fight it out for price control can be found between 110.75-65, with a break lower potentially exposing the recent lows, while on the upside, a resumption of the correction sees 111.00-111.05 as the key resistance ahead of 111.20. As intermarket analysis stands, the reinvigoration in the DXY and equities should serve well the interest of buyers, who would most likely perceive weakness as buy-side opportunities.
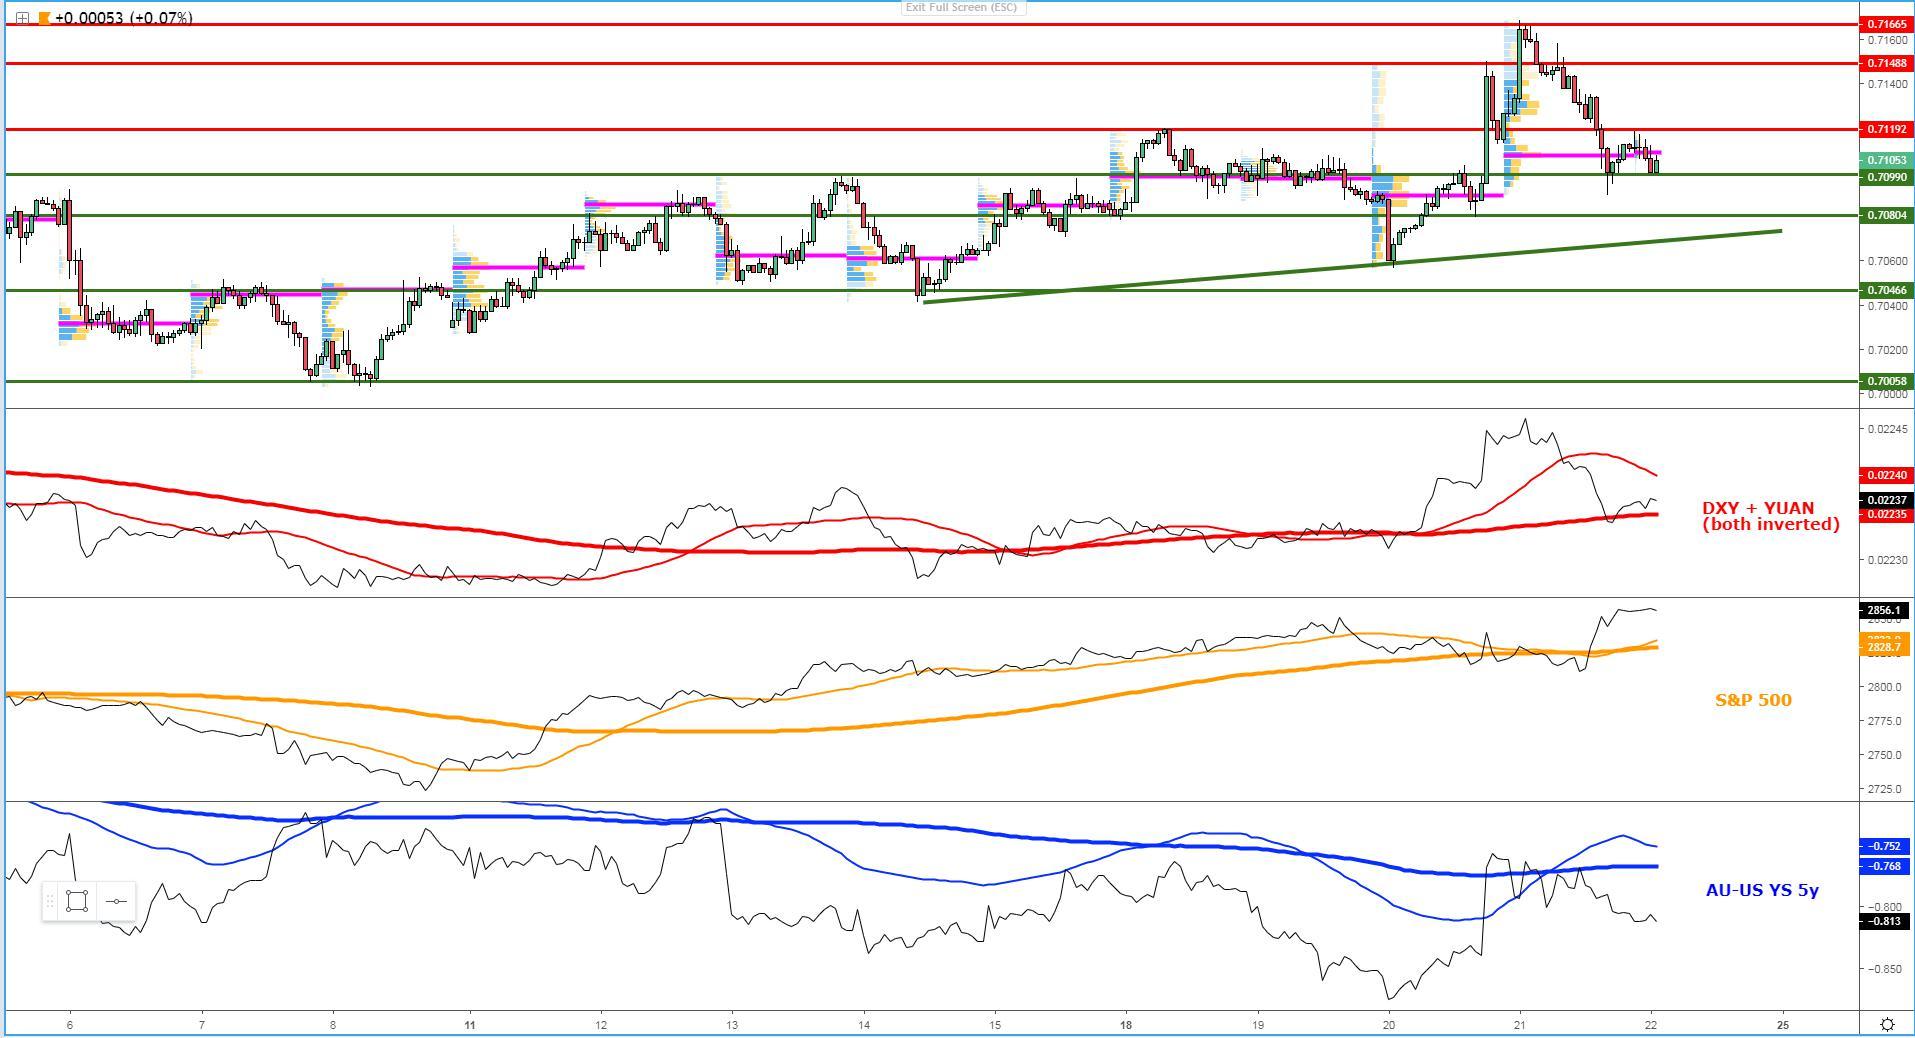
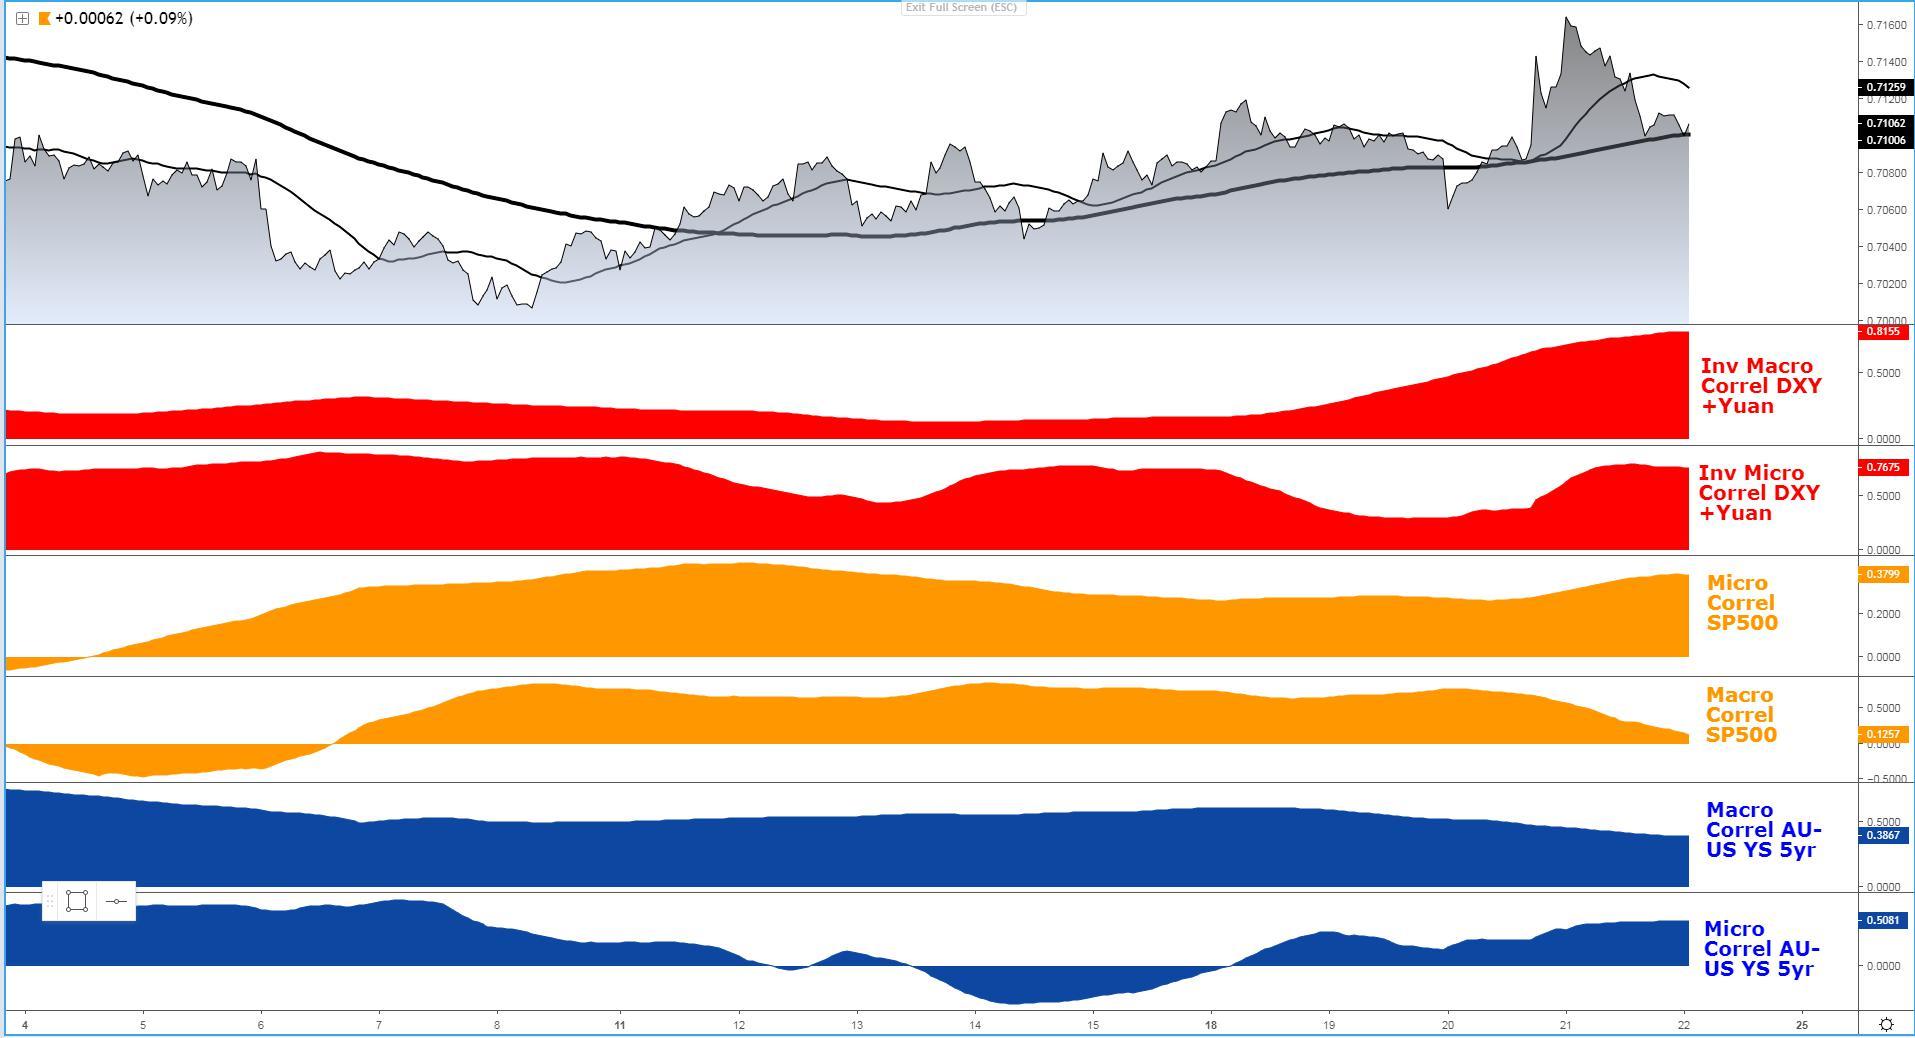
AUD/USD: Technicals NoT Backed By Intermarket Flows
The Aussie has also been a victim of the resurrection in USD buying flows, as the 60+ pips selling off the trend highs reflects. However, unlike the rest of the currencies, where the USD strength has caused damage in technical structures, the same cannot be said about this market. The bullish stepping formation of higher highs and higher lows remains in place, with the setback in the last 24h finding stubborn buyers circa the 0.71 psychological round number. The ascending trendline underneath is the technical manifestation of a structure that remains constructive for the bulls. In terms of intermarket flows, I wouldn’t expect the bullish trend to resume as the lay of the land stands, with only equity flows acting as underlying support for the Aussie, not sufficient to neutralize the sell-side bias that emanates from other correlated instruments such as DXY, yuan and Aus-US bond yield spread. This puts buyers in a difficult position, as technicals disagree with intermarket flows, that’s why further setbacks are a scenario that I can see playing out towards a retest of the bull trendline as all stands.
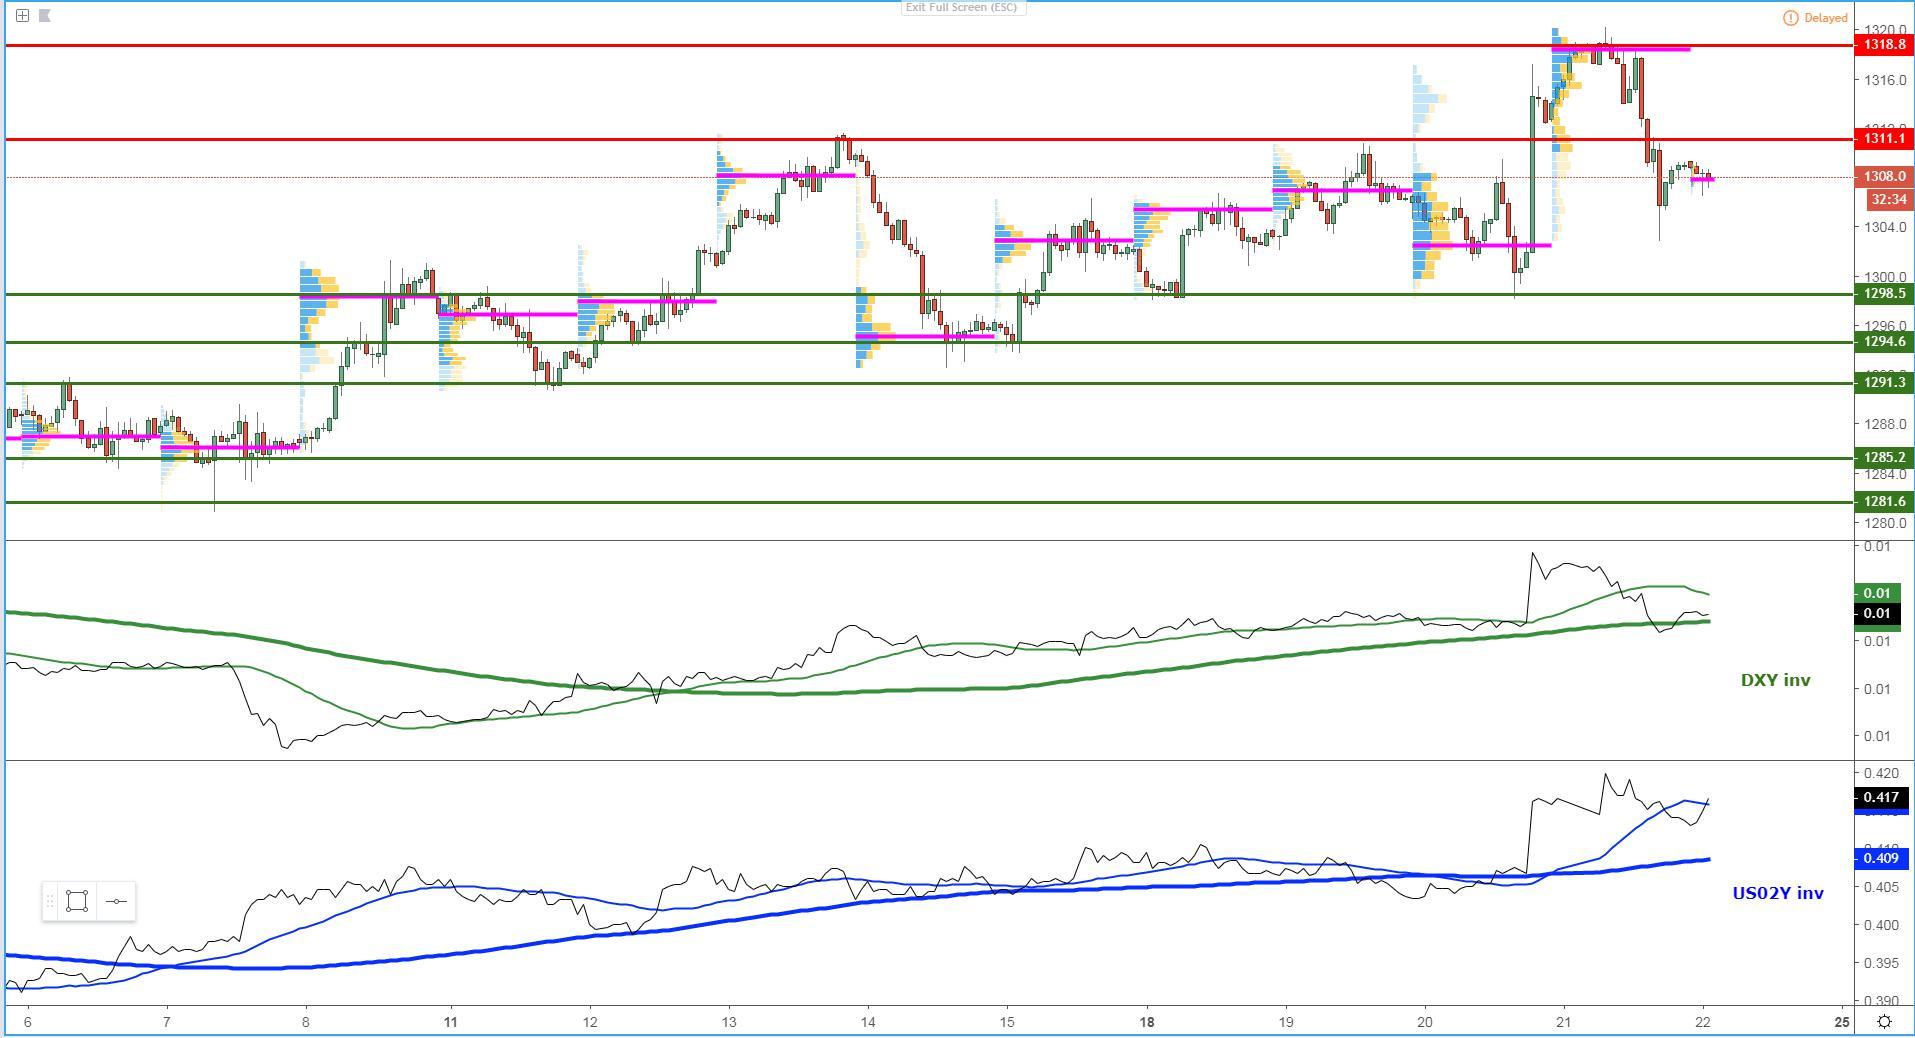
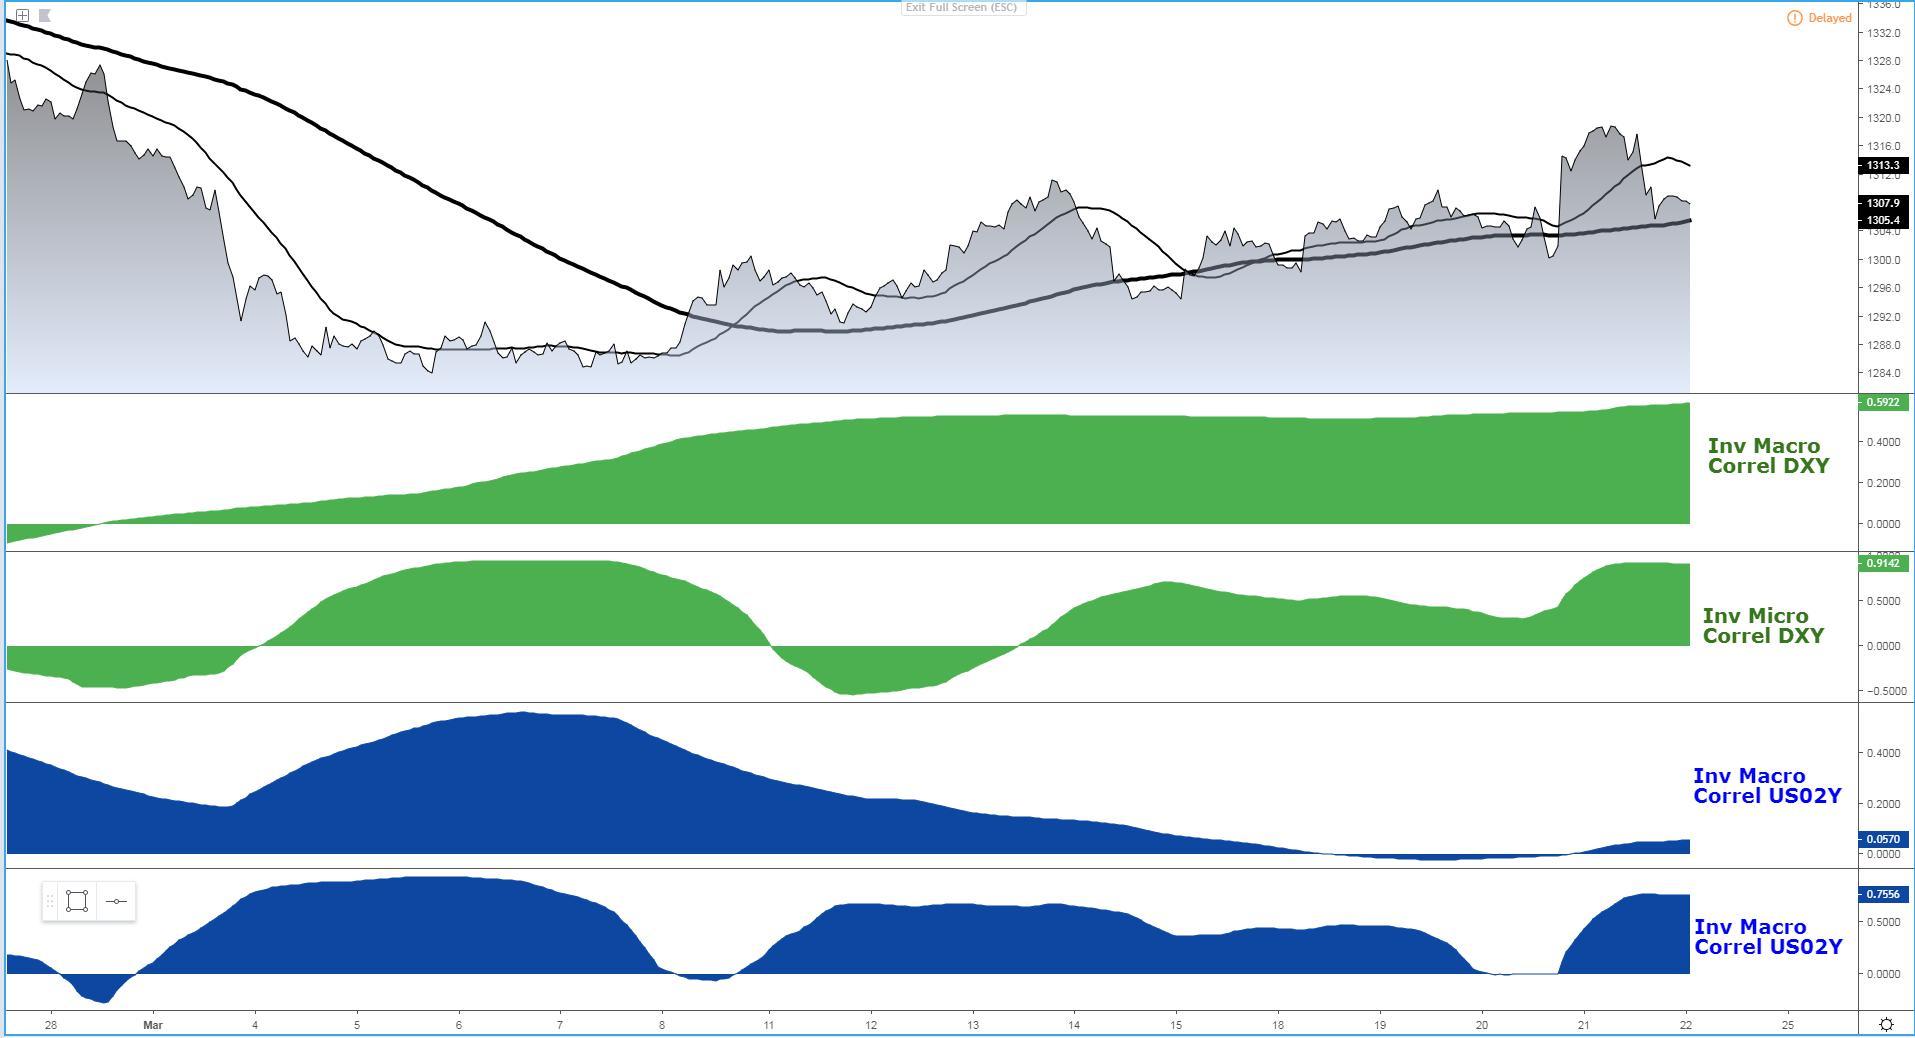
Gold: Case To Buy On Dips, Risk Of Rotational Profile
When all things considered, Gold is still widely perceived as an ideal shelter to diversify one’s portfolio amid the lack of solid investment alternatives in the FX land. Against the USD, and akin to what I’ve shared about the AUD, the precious metal also shows a rather benign technical outlook following the creation of a new up-cycle on the back of the FOMC, which is yet to be invalidated. The latest setback, as part of the USD buying wave seen, has stopped in its tracks at Wed’s POC intersection, where a fairly sizeable tail in the hourly acts as a clear testament of the solid interest to engage in buy-side propositions in that first pass. Looking at intermarket flows, the risk of transitioning into a period of rotational fluctuations in the market, which essentially means fading breakouts as the conviction towards a directional bias wanes. This is predicated on the basis of the conflicting signals from the DXY (strengthening) and US yields (weakening). Overall, gold remains an instrument that should attract decent interest but if you aim to exploit it, there are other currencies with poorer fundamentals or of low yielding nature it can be traded against to maximize potential runs.
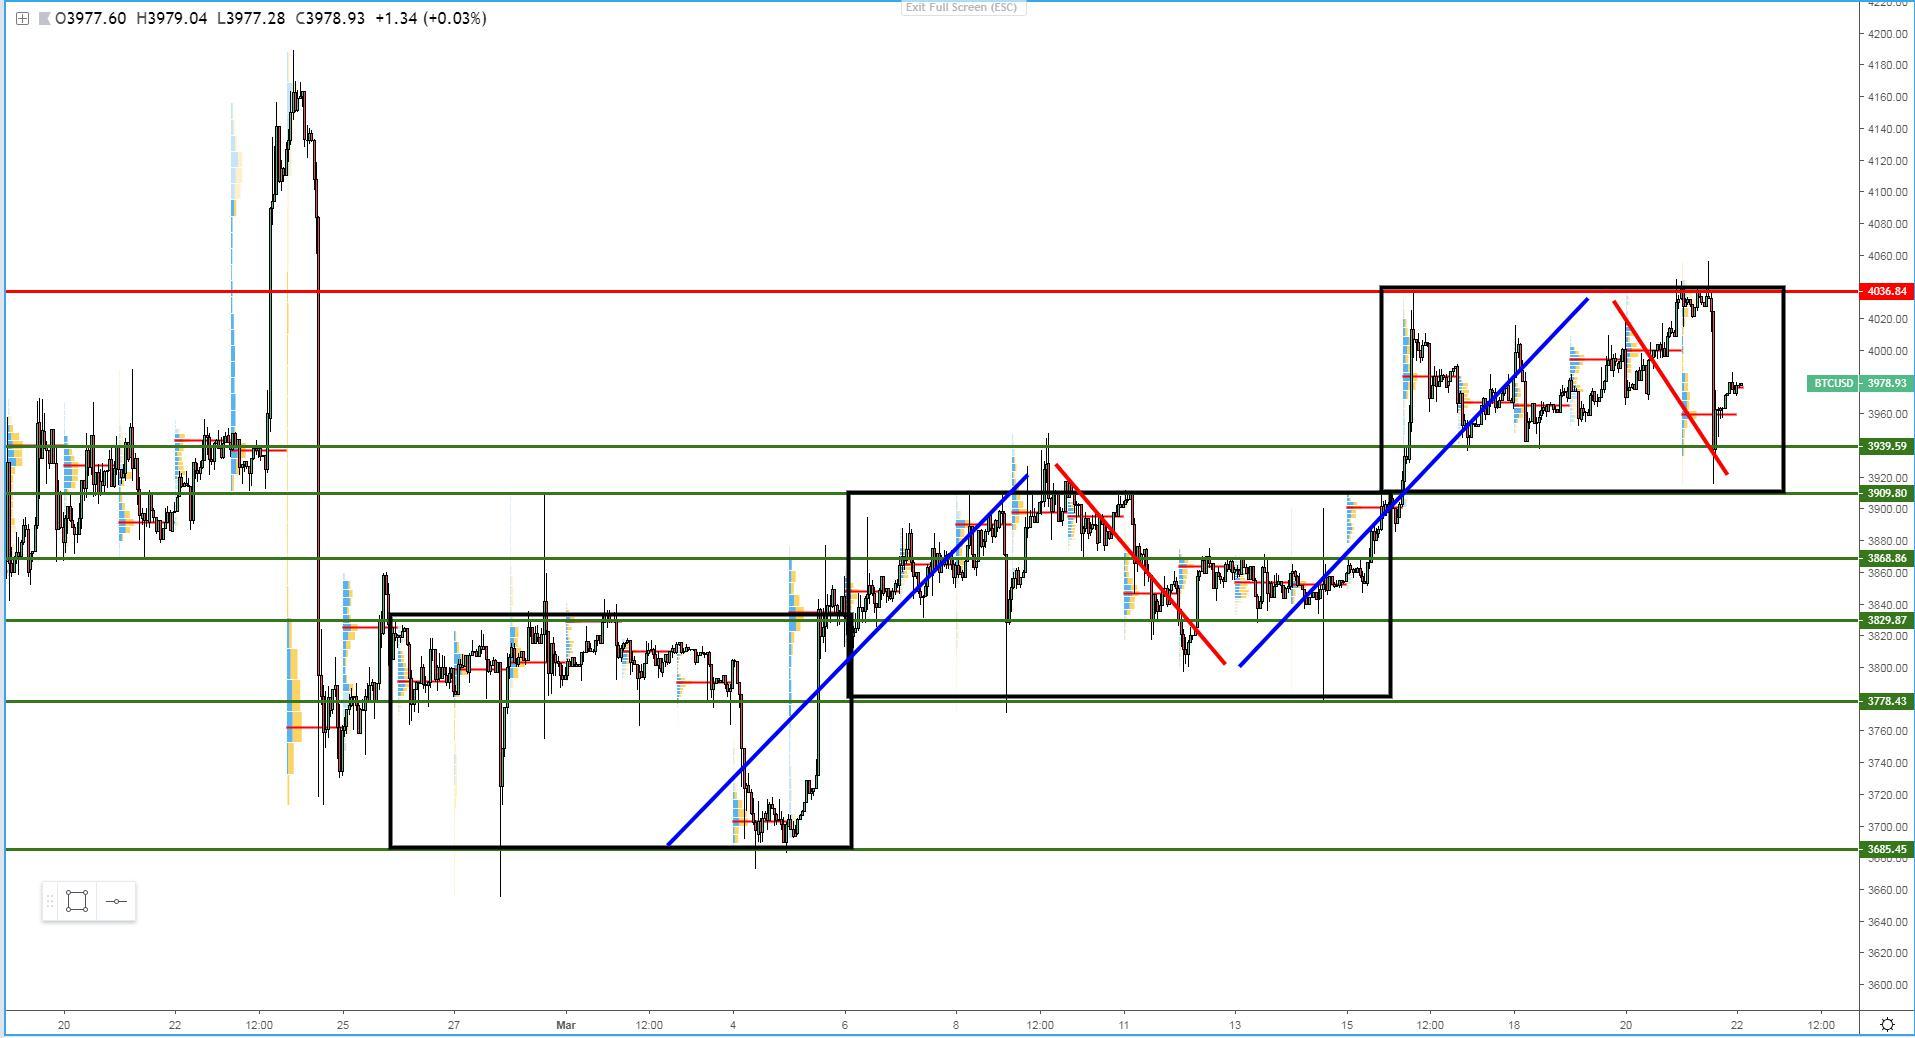
Bitcoin: In A $100 Balance Area, $4k Tough Nut To Crack
The rise in Bitcoin during March has some interesting dynamics worth exploring, which speaks volumes of the commitment by buyers to accumulate the digital currency. The double bottom formation in early March around $3.7k has exhibited technicals merits to have been the onset of a potentially prolonged buy-side campaign. The fact that an almost analogous price pattern involving a double rejection of $3.8k took place shortly after is a vindication that the price has been in a developing bullish cycle phase, where the upside breakout through $3.9k proved the latest clue needed to suggest that we are still missing one more leg to complete a full 3-leg cycle. Clear patterns have emerged in how the cycle has evolved in March, such as each break higher is accompanied by the compression in price dynamics within a $130 range before the next breakout occurs. That’s been very accurate in the formation of the 3 boxes drawn in the chart. Not only that, but each time Bitcoin achieves a new cycle high as the blue line in the chart depicts, in both instances, the rally has been worth $270, but what’s positive about the prospects for an eventual breakout of the current box is the fact that the selling impetus appears to be dying down a tad, as the max extension of the last correction off recent highs could only run for about $130, even if quite impulsive in nature. Overall, the structure in bitcoin still suggests buying on dips is a strategy set to find ample demand.
Important Footnotes
- Risk model: The fact that financial markets have become so intertwined and dynamic makes it essential to stay constantly in tune with market conditions and adapt to new environments. This prop model will assist you to gauge the context that you are trading so that you can significantly reduce the downside risks. To understand the principles applied in the assessment of this model, refer to the tutorial How to Unpack Risk Sentiment Profiles
- Cycles: Markets evolve in cycles followed by a period of distribution and/or accumulation. The weekly cycles are highlighted in red, blue refers to the daily, while the black lines represent the hourly cycles. To understand the principles applied in the assessment of cycles, refer to the tutorial How To Read Market Structures In Forex
- POC: It refers to the point of control. It represents the areas of most interest by trading volume and should act as walls of bids/offers that may result in price reversals. The volume profile analysis tracks trading activity over a specified time period at specified price levels. The study reveals the constant evolution of the market auction process. If you wish to find out more about the importance of the POC, refer to the tutorial How to Read Volume Profile Structures
- Tick Volume: Price updates activity provides great insights into the actual buy or sell-side commitment to be engaged into a specific directional movement. Studies validate that price updates (tick volume) are highly correlated to actual traded volume, with the correlation being very high, when looking at hourly data. If you wish to find out more about the importance tick volume, refer to the tutorial on Why Is Tick Volume Important To Monitor?
- Horizontal Support/Resistance: Unlike levels of dynamic support or resistance or more subjective measurements such as fibonacci retracements, pivot points, trendlines, or other forms of reactive areas, the horizontal lines of support and resistance are universal concepts used by the majority of market participants. It, therefore, makes the areas the most widely followed and relevant to monitor. The Ultimate Guide To Identify Areas Of High Interest In Any Market
- Trendlines: Besides the horizontal lines, trendlines are helpful as a visual representation of the trend. The trendlines are drawn respecting a series of rules that determine the validation of a new cycle being created. Therefore, these trendline drawn in the chart hinge to a certain interpretation of market structures.
- Correlations: Each forex pair has a series of highly correlated assets to assess valuations. This type of study is called inter-market analysis and it involves scoping out anomalies in the ever-evolving global interconnectivity between equities, bonds, currencies, and commodities. If you would like to understand more about this concept, refer to the tutorial How Divergence In Correlated Assets Can Help You Add An Edge.
- Fundamentals: It’s important to highlight that the daily market outlook provided in this report is subject to the impact of the fundamental news. Any unexpected news may cause the price to behave erratically in the short term.
- Projection Targets: The usefulness of the 100% projection resides in the symmetry and harmonic relationships of market cycles. By drawing a 100% projection, you can anticipate the area in the chart where some type of pause and potential reversals in price is likely to occur, due to 1. The side in control of the cycle takes profits 2. Counter-trend positions are added by contrarian players 3. These are price points where limit orders are set by market-makers. You can find out more by reading the tutorial on The Magical 100% Fibonacci Projection