Rudi Fronk and Jim Anthony, cofounders of Seabridge Gold, reflect on market factors that are driving current fluctuations in the gold price.
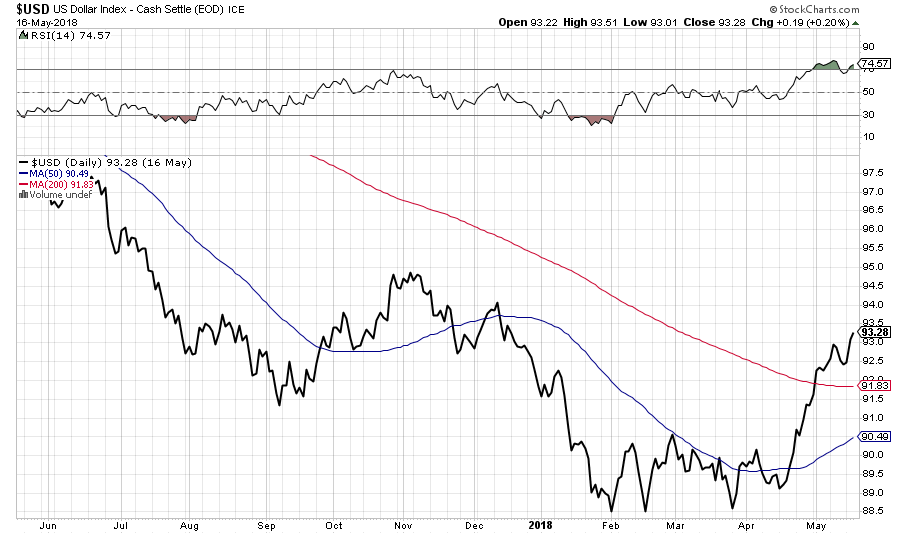
For nearly four months now, gold has been pressured lower by a rising dollar; the inverse correlation has been almost exact. Gold has dropped 5.2% from its January 25, 2018 close of $1,362 to its May 16 close of $1,291.50. Meanwhile, the US dollar index has risen 5.4% from this year’s low close of 88.50 on February 15, 2018, to its close on May 16 at 93.26. In the past few days, shorts have jumped in to press their luck, judging from the increase in CME open interest while the price is falling.
There are growing signs that the correction in gold is over. We will look at the COTs after tomorrow's close, when we expect the latest data will show a big drop in the net speculative long position typical of a bottom. But there are other indicators perhaps even more relevant that are visible now.
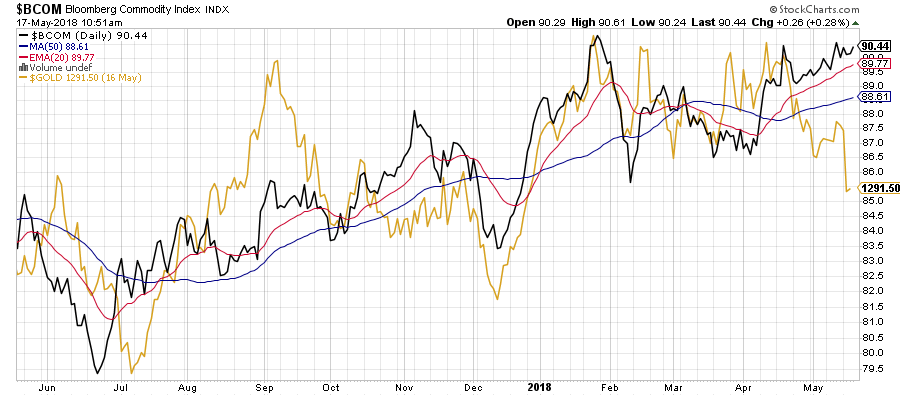
First, gold typically trades with commodities. This week, Brent crude hit another 52-week high while copper, palladium and silver all moved higher. Below, a daily chart of the Bloomberg Commodity Index ($BCOM, the black line) shows that it has been rising steadily since early April, breaking through its 50-day (50dma) and 20-day moving averages, while gold has been falling. This is an unusual divergence as the chart demonstrates: Upticks in $BCOM typically track with gold. It's interesting also to note that commodities are rising despite a stronger dollar. We think $BCOM is signaling inflation and these divergence will not last.

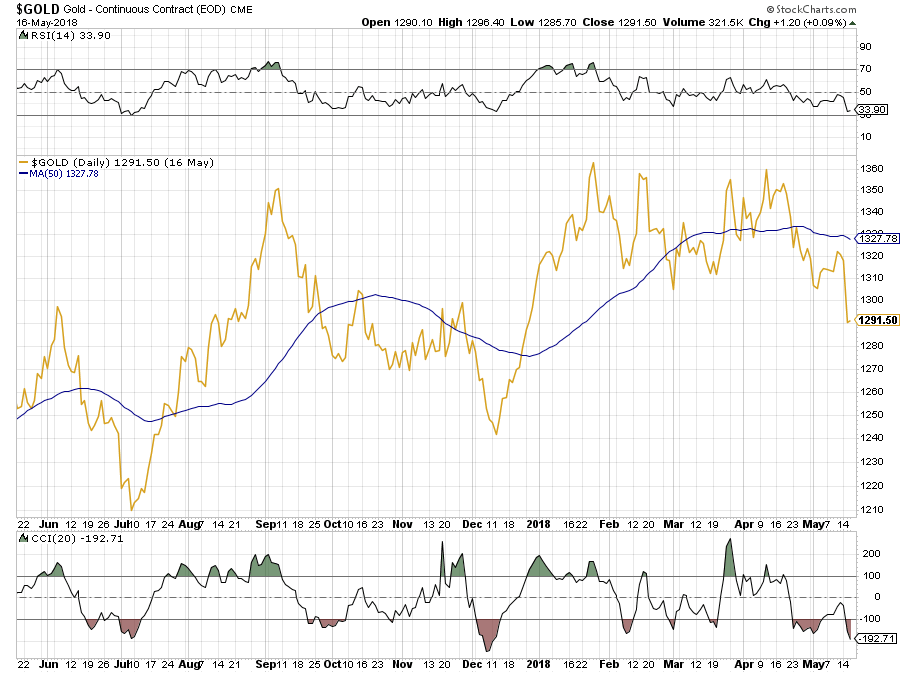
The gold price has fallen to the point where the RSI is close to oversold territory. The CCI (Commodity Channel Index), a good coincident indicator, is signaling that a bottom may be at hand.

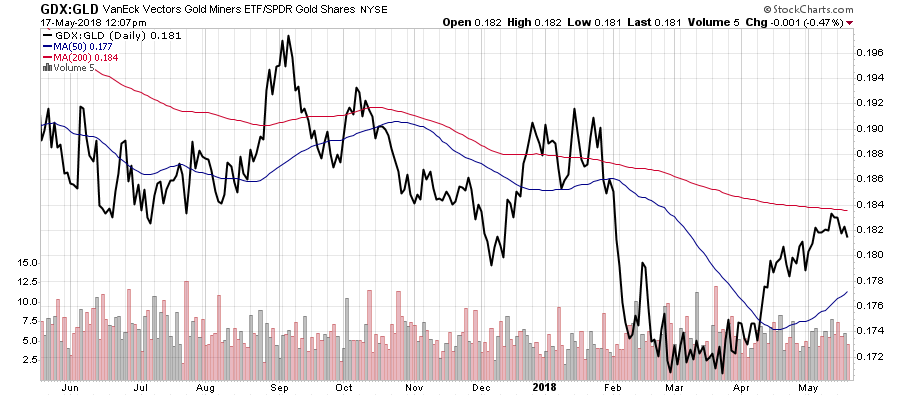
Gold stocks typically lead gold on the way up and on the way down; they therefore tend to bottom first. One way to track this indicator is the ratio of VanEck Vectors Gold Miners (NYSE:GDX), the senior gold stock ETF, to SPDR Gold Shares (NYSE:GLD), the gold ETF. The GDX/GLD ratio has been rising since late March, outperforming gold itself and breaking above its 50dma. Gold has made several new lows since May 1, 2018, but GDX, so far, has not, another useful divergence.

Lance Lewis of the Daily Market Summary has commented on another parameter that points to a turn in the gold price…gold's Daily Sentiment Indicator (DSI). The DSI is a poll of futures traders who are usually in tune with the market. When they are all on one side of the boat, as they have been recently, a turn is likely coming soon, and they are the first to trade it. Therefore, the DSI typically turns before the price does.
The DSI hit 10% on Tuesday of this week, which is lower than the DSI at the December low and matches the low back in July of last year. Wednesday, the DSI rose 3 points to 13% despite gold making a new low close for the correction, a divergence that has marked lows in the past. The HGNSI (Hulbert's survey of gold timers) also imploded 28.25 points to -2.17%, a new low for the move.
As Lewis points out, "There have been exactly three times since late 2016's cyclical bear market that the HGNSI was negative on the same day that the DSI was below 15%. . .Wednesday of this week, July 10, 2017, and December 11, 2017. Both of the 2017 dates marked GLD's low closes for those corrections."
Finally, as we noted at the beginning, the dollar has been the key factor driving the gold price. The dollar index has been rising but mostly against the euro, which accounts for 60% of the index. Meanwhile, as the index rises, its RSI has hit overbought levels usually associated with a turn, and the RSI so far has not made a new high this week along with the dollar. We think the dollar run higher may be nearing its end.

Disclosures: 1) Statements and opinions expressed are the opinions of Rudi Fronk and Jim Anthony and not of Streetwise Reports or its officers. The authors are wholly responsible for the validity of the statements. Streetwise Reports was not involved in any aspect of the content preparation. The authors were not paid by Streetwise Reports for this article. Streetwise Reports was not paid by the authors to publish or syndicate this article. The information provided above is for informational purposes only and is not a recommendation to buy or sell any security. Streetwise Reports requires contributing authors to disclose any shareholdings in, or economic relationships with, companies that they write about. Streetwise Reports relies upon the authors to accurately provide this information and Streetwise Reports has no means of verifying its accuracy.