Breaking News
Investing Pro 0
🙌 It's Here: the Only Stock Screener You'll Ever Need Get Started

Longer-Term Investors Need To Keep Seatbelts Fastened On Bull Train

By David MoenningStock MarketsOct 05, 2020 11:09AM ET
www.investing.com/analysis/longerterm-investors-need-to-keep-seatbelts-fastened-on-bull-train-200539961
Longer-Term Investors Need To Keep Seatbelts Fastened On Bull Train
By David Moenning   |  Oct 05, 2020 11:09AM ET
Saved. See Saved Items.
This article has already been saved in your Saved Items
 

Executive Summary:

The current narrative in the stock market appears to be that with the president and a bunch of White House staffers and Senators having contracted COVID, the chances of a stimulus bill have improved over the last few days. In response, stocks have rallied on the hopes that a deal can get done before the election – or at the very least, before the inauguration. The thinking is that any form of stimulus would be an incremental positive for the economic outlook and, in turn, earnings. However, from my seat, the key thing to recognize here is that stocks remain in a sideways, range-bound phase that will likely need a fundamental trigger of some sort to be resolved. So, until said catalyst appears, traders may want to "ride the range" while longer-term investors are probably best suited to stay seated on the bull train – with their seatbelts tightly fastened, of course.

The Big-Picture Market Models

There is one modest change to report on the Primary Cycle board this week as our Fundamental Factors model slipped back into the neutral zone. However, with the rest of the board sporting a fairly bright shade of green, I believe that (a) the bulls deserve the benefit of any doubt here and (b) a healthy dose of patience may be needed in the coming weeks. But from my seat, it looks like investors should stay the course here.
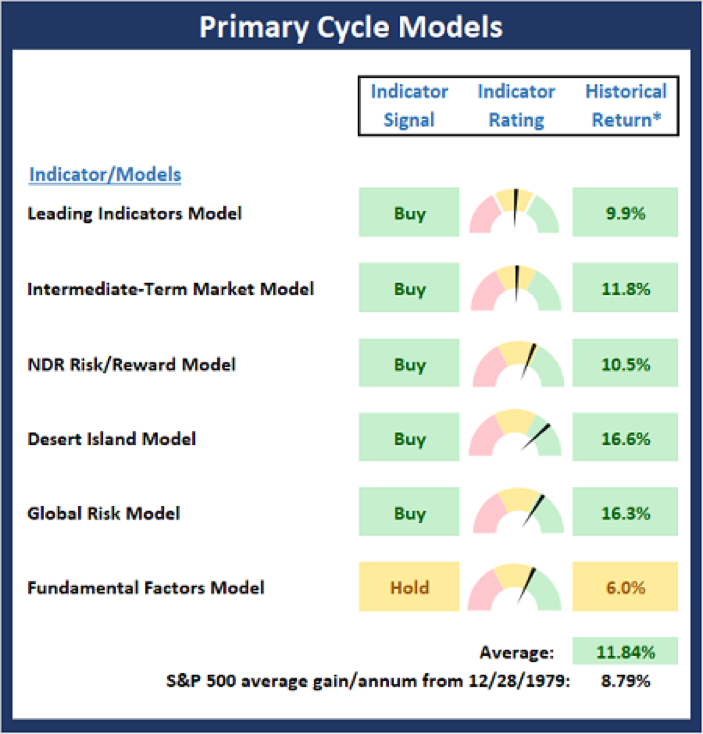
Primary Cycle Models.

* Source: Ned Davis Research (NDR) as of the date of publication. Historical returns are hypothetical average annual performances calculated by NDR. Past performances do not guarantee future results or profitability.

Checking On The "Primary" Cycles

While I don't often make portfolio adjustments based on the long-term trends in the stock market (aka the "primary cycles"), I have found over the years that checking in on state of the cycles and the weekly/monthly charts helps to keep the big-picture in perspective.
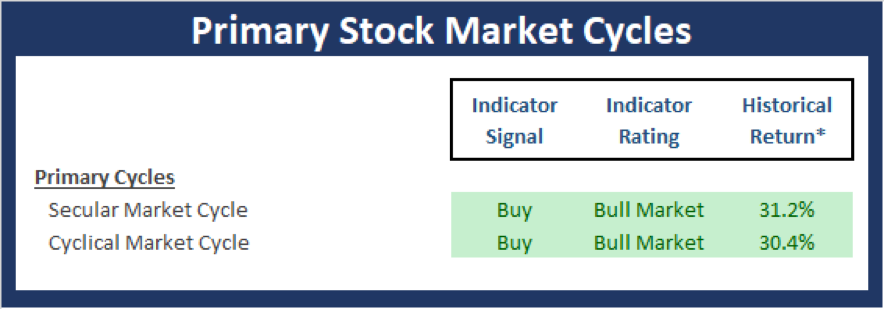
Primary Stock Market Cycles.

* Source: Ned Davis Research (NDR) as of the date of publication. Historical returns are hypothetical average annual performances calculated by NDR. Past performances do not guarantee future results or profitability.

The Secular Market Cycle

Definition: A secular bull market is a period in which stock prices rise at an above-average rate for an extended period (think 5 years or longer) and suffer only relatively short intervening declines.

A secular bear market is an extended period of flat or declining stock prices. Secular bull or bear markets typically consist of multiple cyclical bull and bear markets.

Below is a monthly chart of the S&P 500 Index illustrating the current cycle, which we estimate began on March 9, 2009.
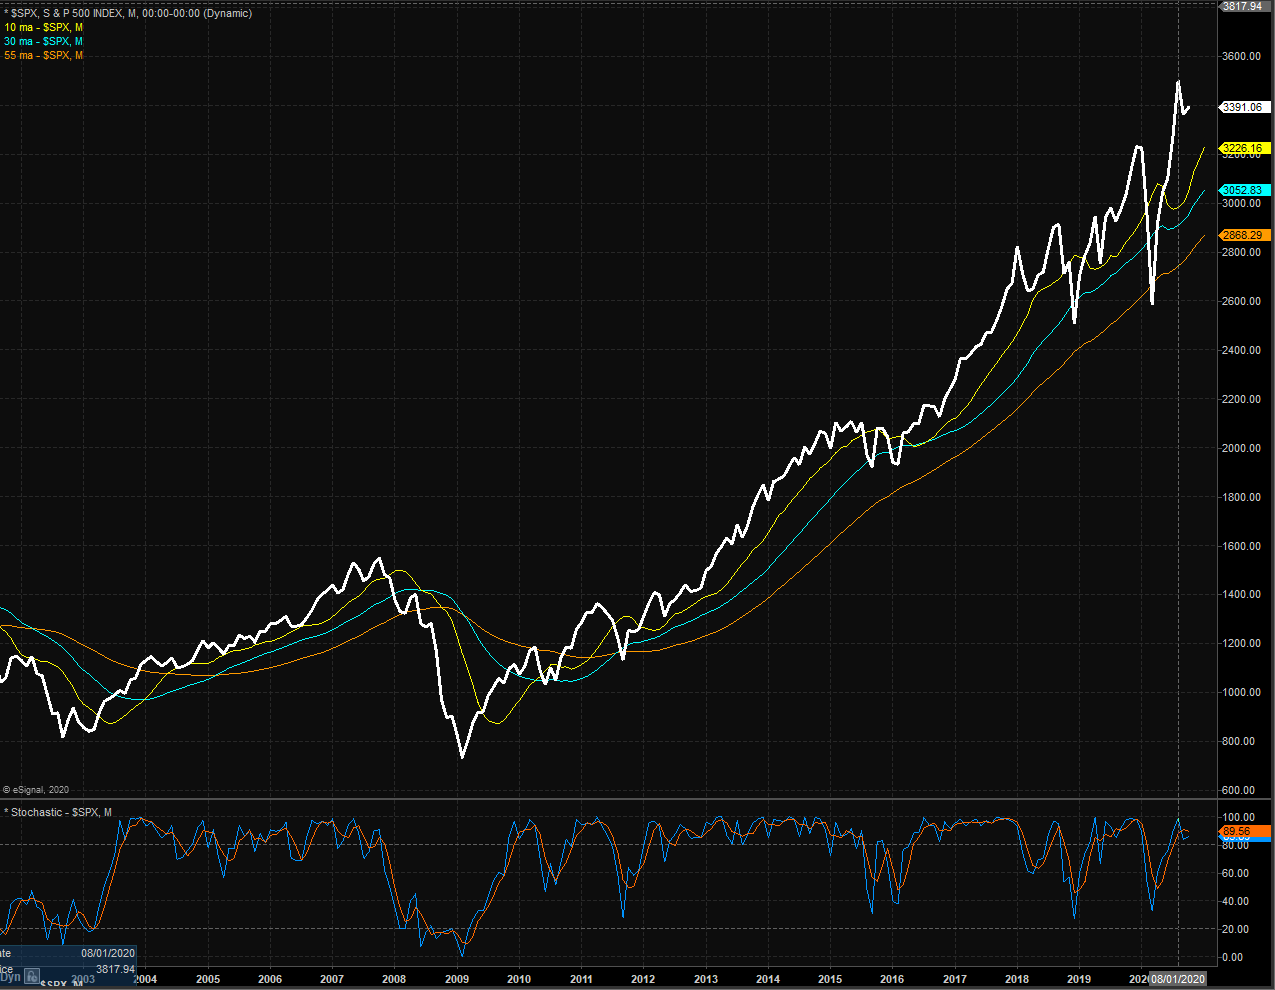
S&P 500 Monthly Chart.

The Cyclical Market Cycle

Definition: A cyclical bull market requires a 30% rise in the DJIA after 50 calendar days or a 13% rise after 155 calendar days. Reversals of 30% in the Value Line Geometric Index since 1965 also qualify.

A cyclical bear market requires a 30% drop in the DJIA after 50 calendar days or a 13% decline after 145 calendar days. Reversals of 30% in the Value Line Geometric Index also qualify.

Below is a weekly chart of the S&P 500 illustrating the current cycle, which we estimate began on March 24, 2020.
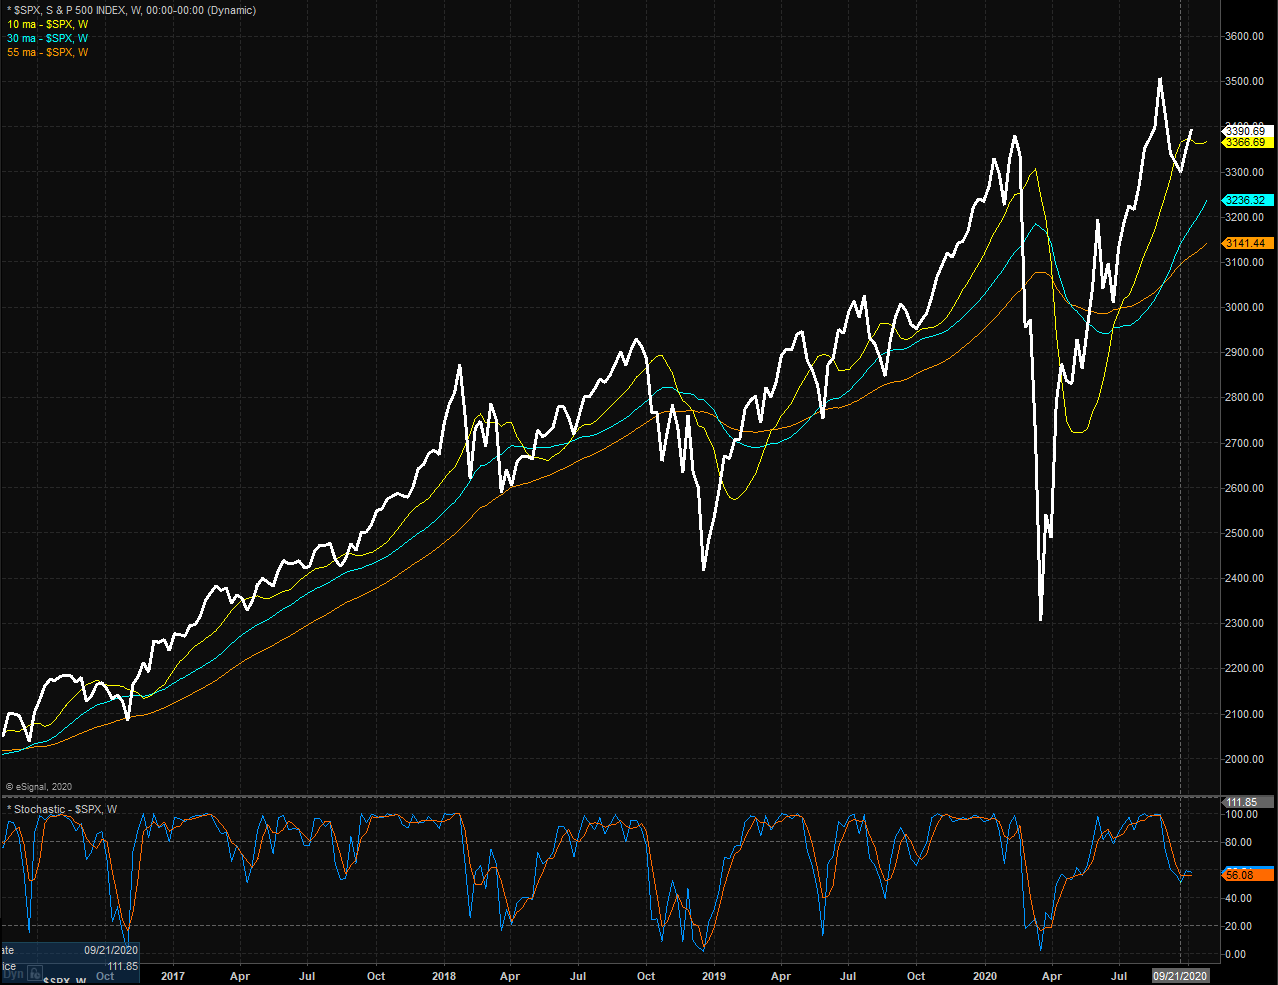
S&P 500 Weekly Chart.

Thought For The Day:

Choose a job you love, and you will never work a day in your life. 
-Confucius

Longer-Term Investors Need To Keep Seatbelts Fastened On Bull Train
 

Related Articles

Al Brooks
E-Mini Breaks Above February High By Al Brooks - Jun 02, 2023

Emini daily chart S&P 500 Futures breaking above February high The bulls got a strong entry bar following the H1 buy setup on Wednesday. They want a second leg up following last...

Longer-Term Investors Need To Keep Seatbelts Fastened On Bull Train

Add a Comment

Comment Guidelines

We encourage you to use comments to engage with other users, share your perspective and ask questions of authors and each other. However, in order to maintain the high level of discourse we’ve all come to value and expect, please keep the following criteria in mind:  

  •            Enrich the conversation, don’t trash it.

  •           Stay focused and on track. Only post material that’s relevant to the topic being discussed. 

  •           Be respectful. Even negative opinions can be framed positively and diplomatically. Avoid profanity, slander or personal attacks directed at an author or another user. Racism, sexism and other forms of discrimination will not be tolerated.

  • Use standard writing style. Include punctuation and upper and lower cases. Comments that are written in all caps and contain excessive use of symbols will be removed.
  • NOTE: Spam and/or promotional messages and comments containing links will be removed. Phone numbers, email addresses, links to personal or business websites, Skype/Telegram/WhatsApp etc. addresses (including links to groups) will also be removed; self-promotional material or business-related solicitations or PR (ie, contact me for signals/advice etc.), and/or any other comment that contains personal contact specifcs or advertising will be removed as well. In addition, any of the above-mentioned violations may result in suspension of your account.
  • Doxxing. We do not allow any sharing of private or personal contact or other information about any individual or organization. This will result in immediate suspension of the commentor and his or her account.
  • Don’t monopolize the conversation. We appreciate passion and conviction, but we also strongly believe in giving everyone a chance to air their point of view. Therefore, in addition to civil interaction, we expect commenters to offer their opinions succinctly and thoughtfully, but not so repeatedly that others are annoyed or offended. If we receive complaints about individuals who take over a thread or forum, we reserve the right to ban them from the site, without recourse.
  • Only English comments will be allowed.
  • Any comment you publish, together with your investing.com profile, will be public on investing.com and may be indexed and available through third party search engines, such as Google.

Perpetrators of spam or abuse will be deleted from the site and prohibited from future registration at Investing.com’s discretion.

Write your thoughts here
 
Are you sure you want to delete this chart?
 
Post
Post also to:
 
Replace the attached chart with a new chart ?
1000
Your ability to comment is currently suspended due to negative user reports. Your status will be reviewed by our moderators.
Please wait a minute before you try to comment again.
Thanks for your comment. Please note that all comments are pending until approved by our moderators. It may therefore take some time before it appears on our website.
Comments (2)
Cameron Wall
Cameron Wall Oct 06, 2020 3:30AM ET
Saved. See Saved Items.
This comment has already been saved in your Saved Items
Thanks David, interesting article. Love your quotes as well, mindset is everything.
William M KPODE
William M KPODE Oct 05, 2020 11:51AM ET
Saved. See Saved Items.
This comment has already been saved in your Saved Items
According to the monthly chart of SP500 , from 2004 where I can figure out from , the market has been all the way BULLISH till 2009 where we had a crash which i don't know the cause of it and after that since 2009 until Feb to March 2020's Market crash during the pandemic . I am so impressed the fact that there was no delay on the market recovery as price rose again to all time high . @DavidMoenning
Tommi Nuutinen
Tommi Nuutinen Oct 05, 2020 11:51AM ET
Saved. See Saved Items.
This comment has already been saved in your Saved Items
wach a great movie "The Big Short" and then you'll know how the crash happened.
 
Are you sure you want to delete this chart?
 
Post
 
Replace the attached chart with a new chart ?
1000
Your ability to comment is currently suspended due to negative user reports. Your status will be reviewed by our moderators.
Please wait a minute before you try to comment again.
Add Chart to Comment
Confirm Block

Are you sure you want to block %USER_NAME%?

By doing so, you and %USER_NAME% will not be able to see any of each other's Investing.com's posts.

%USER_NAME% was successfully added to your Block List

Since you’ve just unblocked this person, you must wait 48 hours before renewing the block.

Report this comment

I feel that this comment is:

Comment flagged

Thank You!

Your report has been sent to our moderators for review
Continue with Google
or
Sign up with Email