Besides the fact that experienced traders kept hammering on and on that regardless of what type of a system you are trading, you should always do your long term analysis, my stubborn ambition got the best of me, and the mistakes I did previously were mainly because of a lack of a proper long term analysis.
Of course, day traders can always find positions every day, my goal is to set up a proper long term outlook, not just because I want to focus on part-time trading, but also, when again I return to day trading (not scalping) I am only going to look at opening positions that are in agreement with my long term outlook on any pair.
Also, I am starting to add some technical indicators in to my price action analysis, in order to have a confirmation for my bias.
The color of the lines represents the Time Frame on where the S/R was found, and where in my humble opinion that S/R belongs to.
Pink – Monthly
Blue- Weekly
Red- Daily
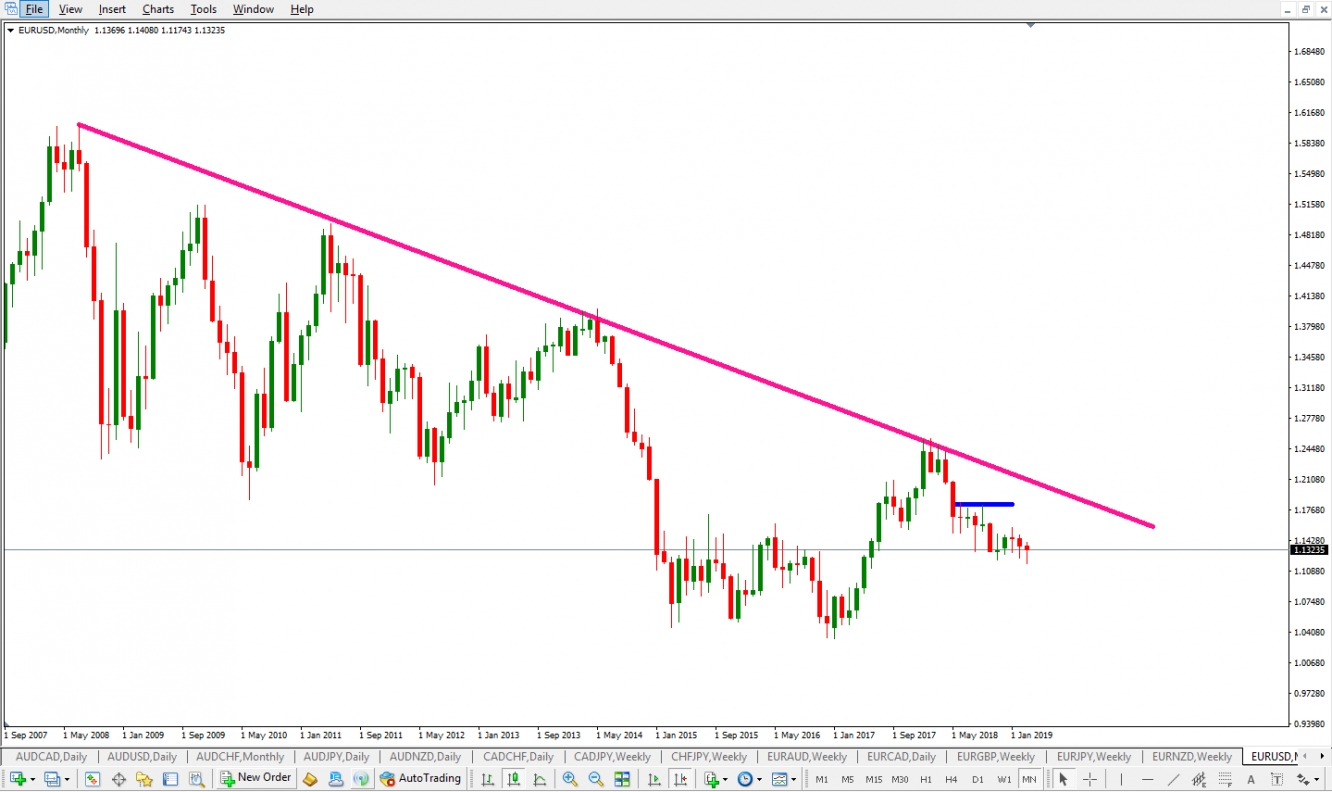
EUR/USD – Monthly Time Frame
The Fiber has been in a long term downtrend, which can be seen by the clearly definable trend line since 2008. Price has retested this trend line 8 times in the past 11 years already. And for the past few months, the price has been flip-flopping in no man’s land, without any clear directional bias. At this point in time, I am not even considering any short term positions on this pair, since the current price action looks very ugly. Moreover, the latest swing to the downside has not made a lower low, and even though this happened previously, I really do not like how all of this looks.
If the price comes to retest the long term trendline, and gives me a price formation from a conservative point of view, I might consider searching for a short opportunity, otherwise, as of this moment, I am not touching The Fiber on any time frame.
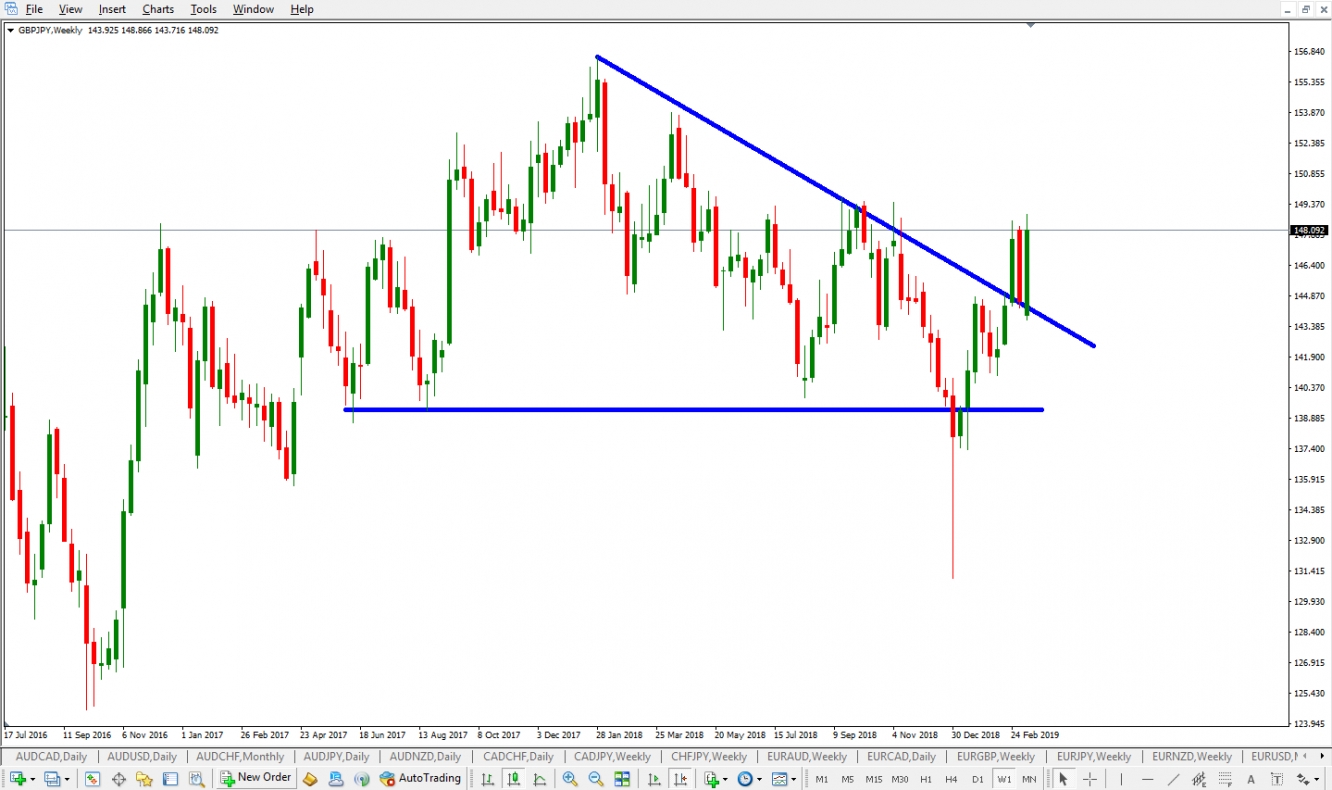
GBP/JPY – Weekly Time Frame
Even though Brexit negotiations are still strongly in place, which means that anything could happen with this pair, as I have said before, Fundamentals do not affect long term setups. This is especially true for a setup on the weekly time frame, since candles on the weekly time frame can be 150 + pips, and no matter what happens with Brexit, it will just be a price spike on the Weekly time frame.
The “Gopher” (or Guppy) as traders call this pair, 3 candles ago, or 3 weeks ago broke out of a descending triangle formation that has lasted for the past 2 years. The breakout happened to the upside, which was not the overall bias, and the price has already retested the broken trendline, which was previous resistance and now became support.
As of this moment, the bias is to the upside, even though I am not liking the Breakout Pullback Continuation formation since the candles are too big and volatile. The Breakout itself did not give me any price formation that I can trade.
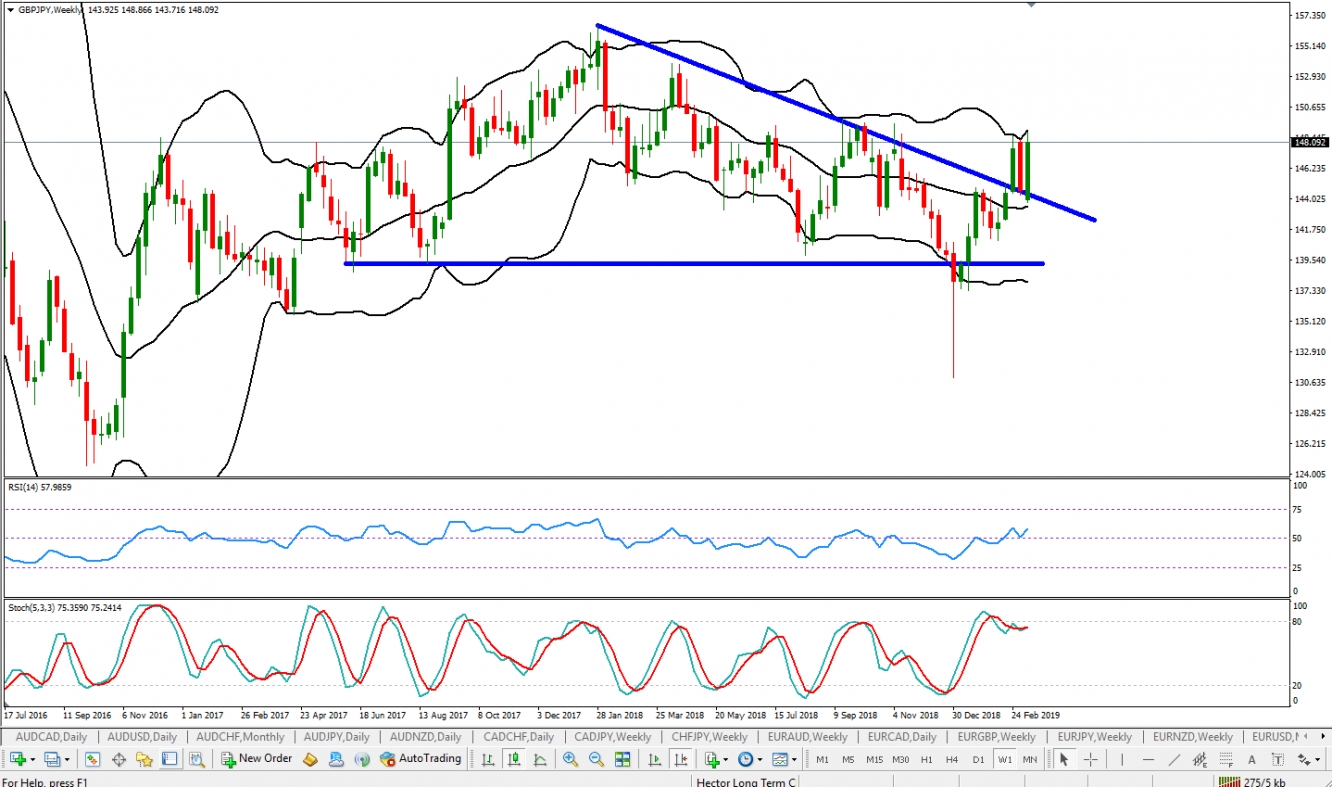
We can also observe that the upper Bollinger band has been touched, and in general price is closer to the upper Bollinger, and also Stochastic is closer to the overbought level, but still has some leeway to go up since a crossover of the Stochastic MA’s just happened. Additionally, the RSI is still above 50, which gives me strong confidence that the bulls are still in control.
I did not get any valid signal on the longer time frames, and as we can observe from the chart, the price has a highway free of traffic to the upside. So what I would do is search only for Long opportunities on GBP/JPY on the smaller time frames (Daily, H4, H1).


