The main events of the week will occur starting from Wednesday, when will be meeting of the Bank of Canada. Then, the European Central Bank will meet on Thursday. And finally, on Friday, data on US GDP for the 3rd quarter will be published. All of these events, from my point of view, will lead to a new wave of strengthening of the US dollar, which will reflect the immutability of the monetary policy of the above-mentioned regulators and strong statistics on the American economy. In the first trading sessions, up to the middle of the week, there will be attempts at corrective movement of currency pairs in the markets, in order to increase the number of “bears” on US dollar. The second half of the week, as noted above, will be held under the sign of the superiority of the "bulls" on the dollar. The probability of such a scenario is indicated by the formation of a set of signals on the H1 timeframe, which should be realized by a local weakening of the dollar. There are no signals on larger time frames, which indicates the short duration of the predicted movements in the markets at the beginning of the week. The quotes of the analyzed pairs should return to their 200-periodic moving averages on the H1 time frame today or tomorrow, after which the correction in the market will end.
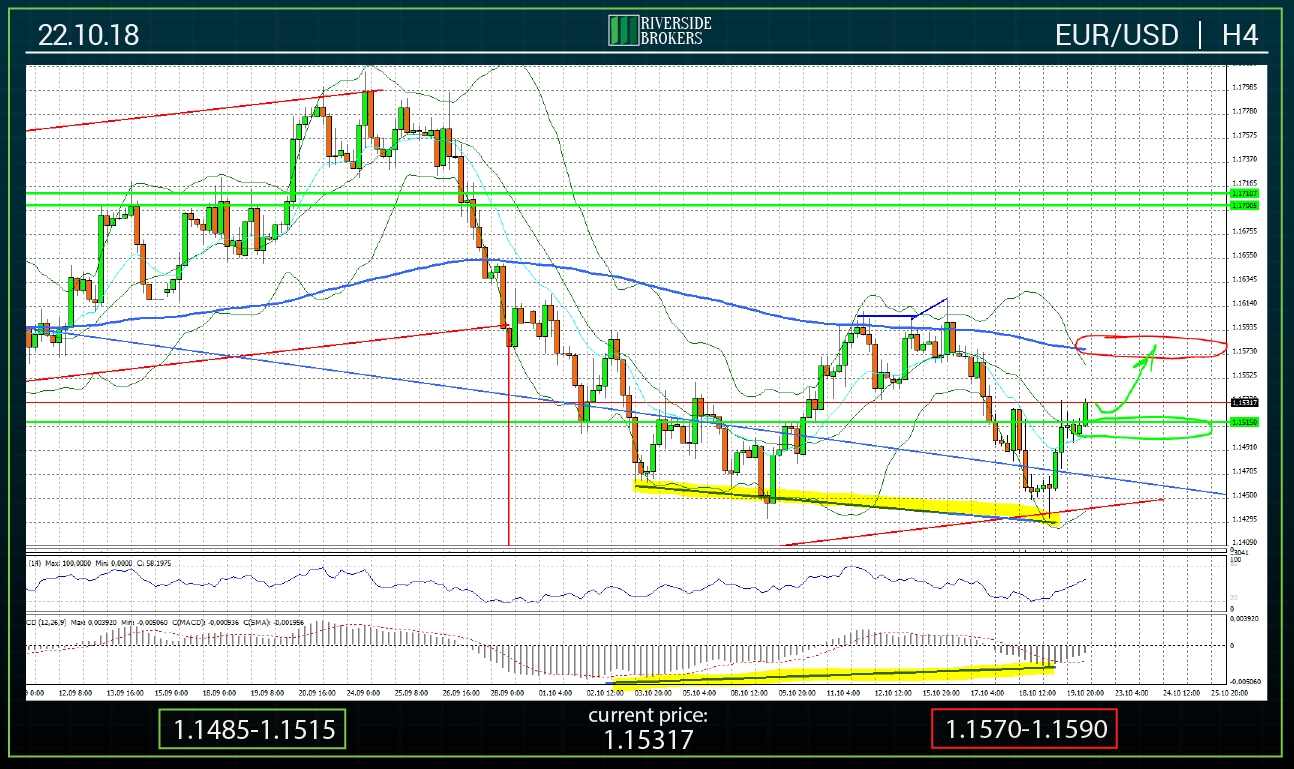
Today, the EUR/USD pair is expected to maintain positive dynamics of quotes in order to achieve a 200-period moving average around 1.1570-1.1590. As noted in the previous review, as a result of the decline in prices in the middle of last week, the pair approached the price ranges, which are significant support levels. To overcome this area 1.1430-1.1460, the market needs to take a small acceleration, which will be facilitated by the correctional price movement observed since Friday due to the local weakening of the US currency.
On Monday-Tuesday, in the absence of important economic statistics and a calm news background, the pair will oscillate around its 200-period MA on H1 and H4 time frames in the area of 1.1520-1.1570.
The ECB meeting scheduled for Thursday and press conference of the head of the regulator Mario Draghi can be a trigger for the resumption of negative dynamics, after which the markets will establish themselves in the opinion that monetary policy remains unchanged for a long time.
Support and resistance zones are located in areas 1.1485-1.1515 and 1.1570-1.1590, respectively.
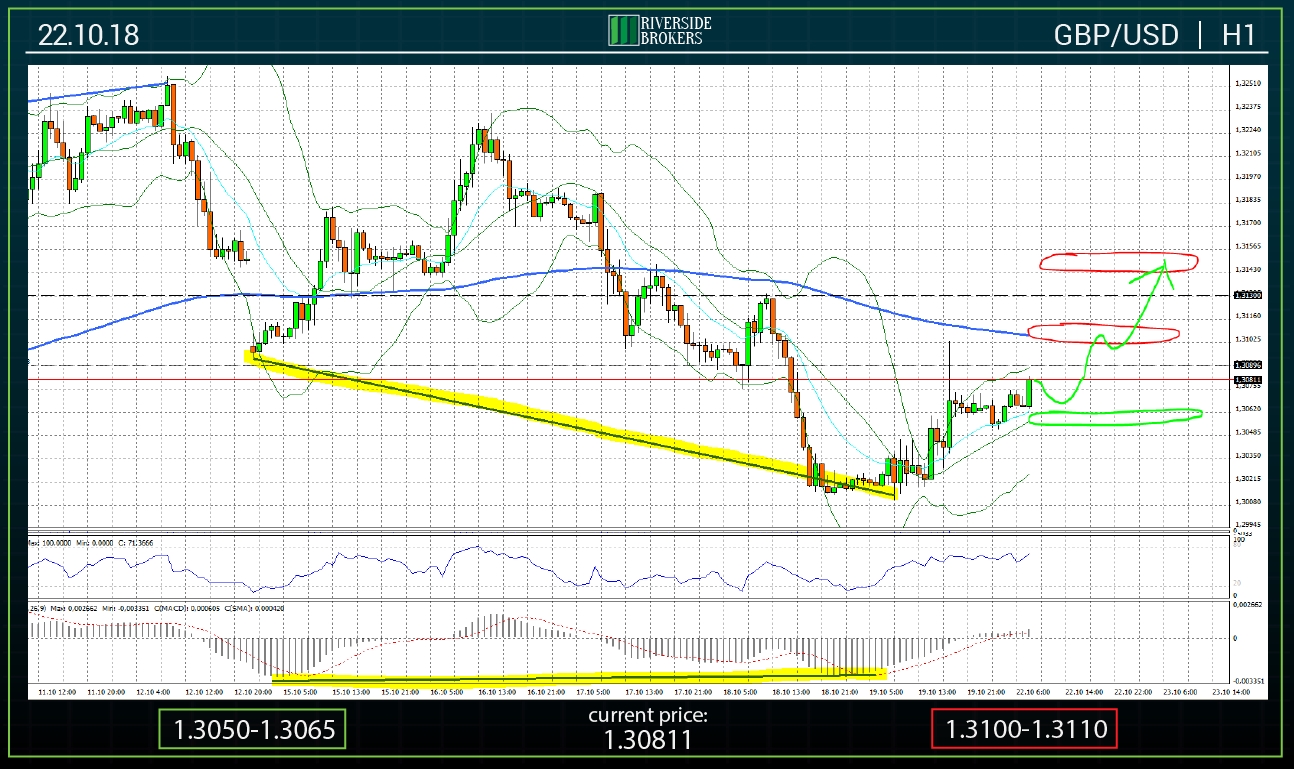
In the previous overview, the GBP/USD chart showed a convergence between the local lows and the corresponding values of the MACD indicator, which led to the beginning of the corrective movement on Friday. Today, in the first half of the day, quotes are trying to reach the area near the 1.3100 mark, where the 200-period MA is located on the H1 time frame. However, it should keep in mind that this local weakening of the US dollar is short-term and anticipates the beginning of a more substantial decline in prices predicted in the second half of the week in order to achieve the minimum values of the current year in the medium term.
The support zone today is in the area of 1.3050-1.3065 (green oval).
Resistance zones are consequentially present in the ranges 1.3100-1.3110 and 1.3145-1.3155 (red ovals).
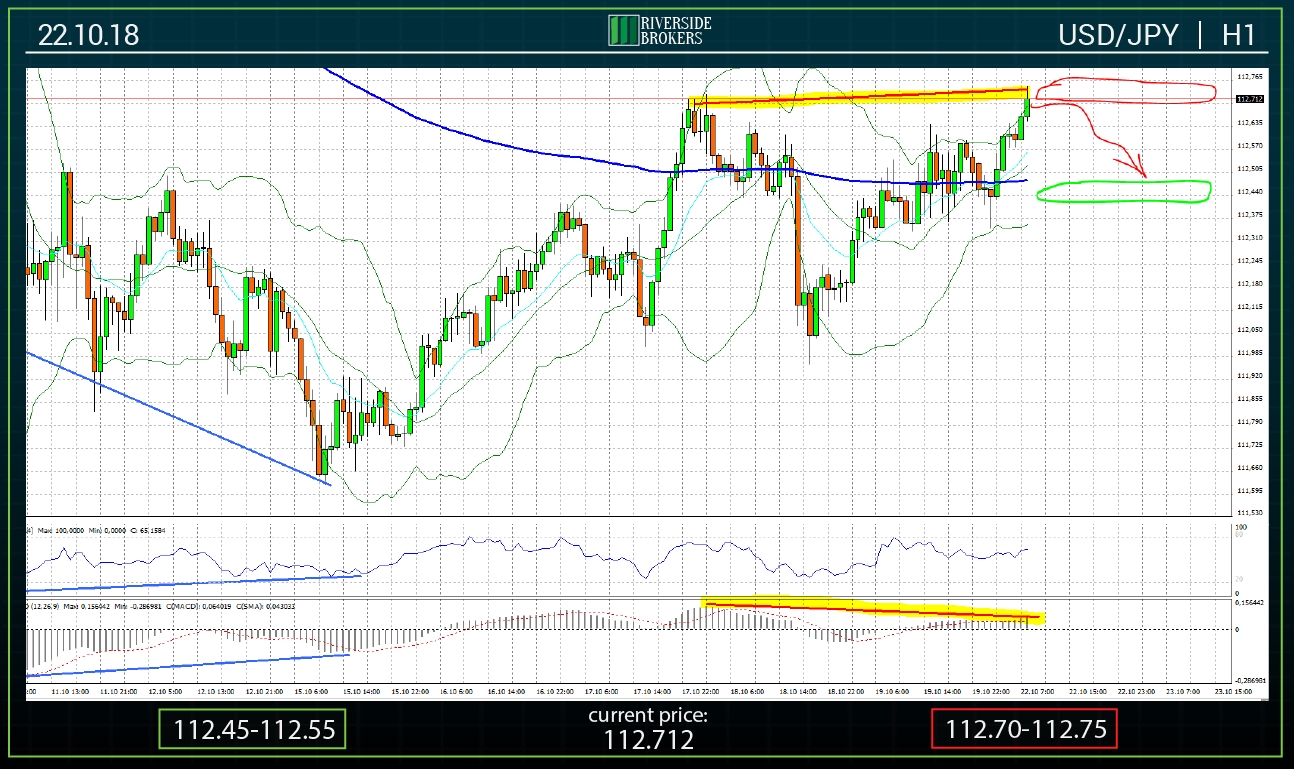
From a technical point of view, a divergence between the maximum prices on October 17, the morning hours of Monday and the corresponding values of the MACD indicator is formed on the USD/JPY chart, which makes it possible to make an assumption about the probability that the pair will return to its 200-period MA around 112.50. After the completion of this local negative dynamic, a resumption of price growth is predicted in the second half of the week and reaching a mark of 113.00.
The support zone today is the range of 112.45-112.55 (green oval).
The zone of resistance is located in the area 112.70-112.75 (red oval).
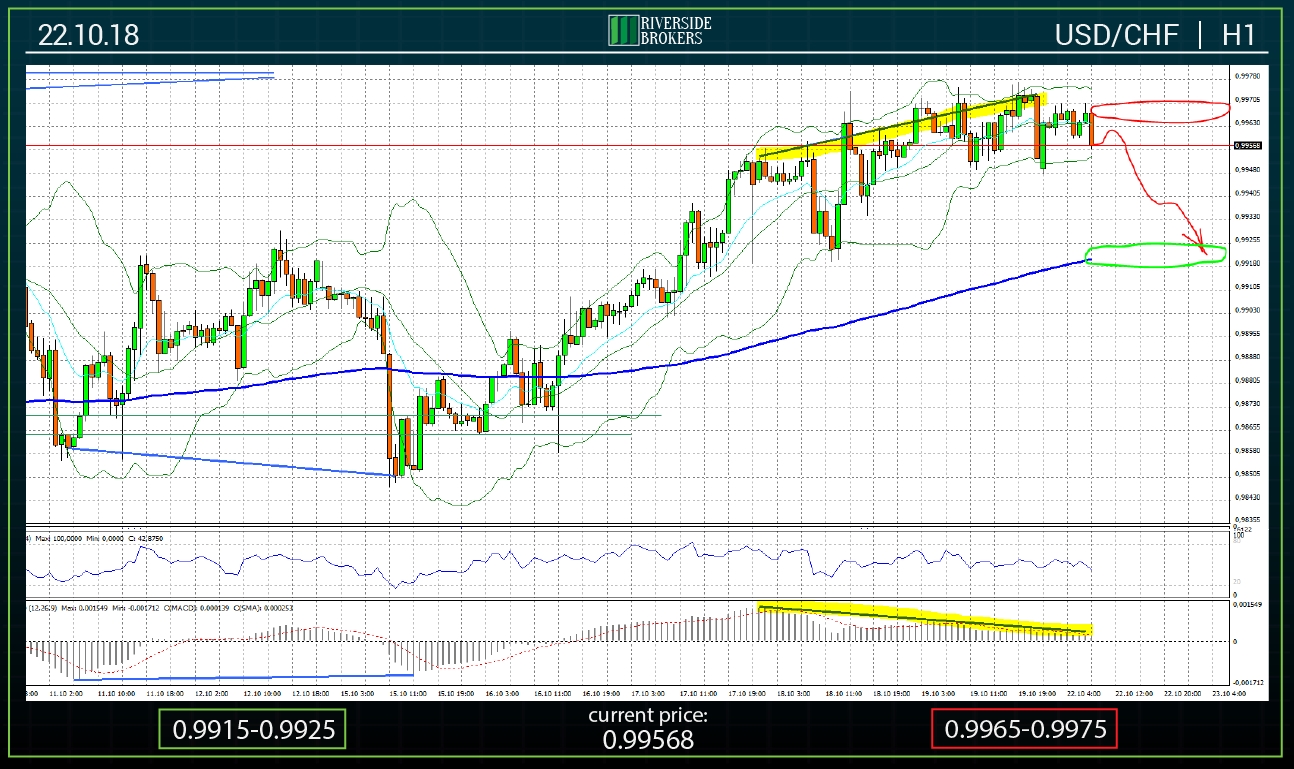
The technical picture of USD/CHF is similar to USD/JPY. As a result of trading on Friday and in the first hours of Monday, prices stabilized near the local maximum values of 0.9950-0.9970, not finding the opportunity to continue growth. At the same time, the divergence between the highs of prices and the corresponding values of the MACD indicator has completed its formation. This circumstance suggests the beginning of the negative dynamics of quotations and the return of prices to the area just above the mark of 0.9900, where the support zone is located. In the second half of the week, the resumption of the strengthening of the US dollar and the update of the last week's maximum prices is predicted.
The support zone today is located in the area of 0.9915-0.9925 (green oval).
Resistance is present in the range 0.9965-0.9975 (red oval).


