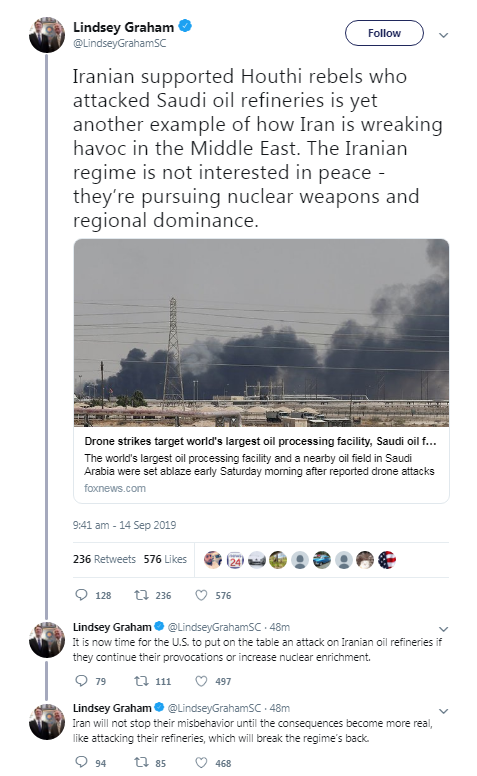
Senator Lindsey Graham unleashed a series of tweets Saturday morning after learning of drone attacks on Saudi oil refineries.
I've yet to hear whether the Saudis will blame/have blamed Iran for the attacks and whether war will eventually be declared against them. It's been reported that,
"Houthi rebels - who are backed by Iran in a yearslong Saudi-led war against them in Yemen - have reportedly claimed responsibility for the attacks and have vowed that further attacks could be expected in the future."
No doubt, this will affect oil prices when futures trading begins later on Sunday.
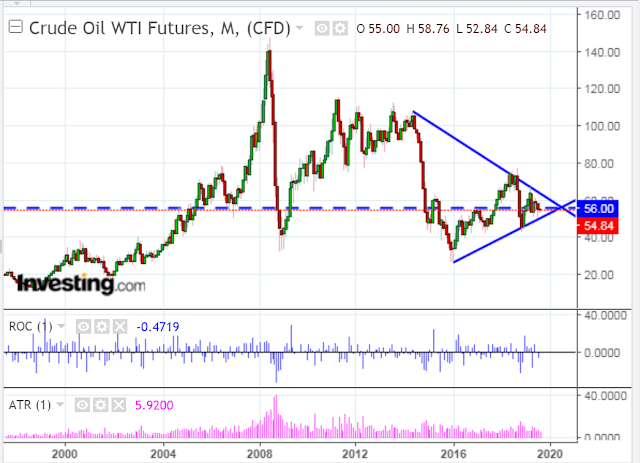
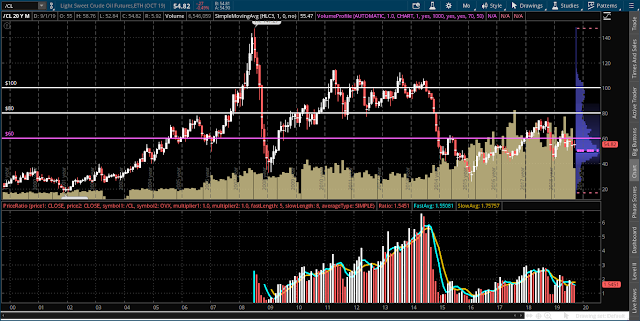
Light Crude Oil futures closed on Friday at 54.84. As shown on the following monthly chart of CL, it's sitting just below the apex (at 56.00) of a large triangle and is about to breakout of this formation soon.
Saturday's news from Saudi Arabia may be the catalyst that catapults CL out of this triangle and to new highs for 2019 and beyond.
I've shown the ROC and ATR technical indicators in histogram format with an input value of one period. Keep an eye on the ROC to spike back above the zero level and climb higher to confirm higher prices. As well, watch for an expansion of the ATR on such a move, and, ultimately, for an exceptionally high exhaustion spike to signal either a pause in price or a trend reversal.
From the Volume Profile shown on the right-hand side of the following monthly chart of CL, major support sits at 50.00, which happens to be the Volume Profile's POC (point of control) on this timeframe.Near-term resistance sits at 60.00. A breakout and hold above that could send price as high as 80.00, or even higher to 100.00, as others are now speculating.
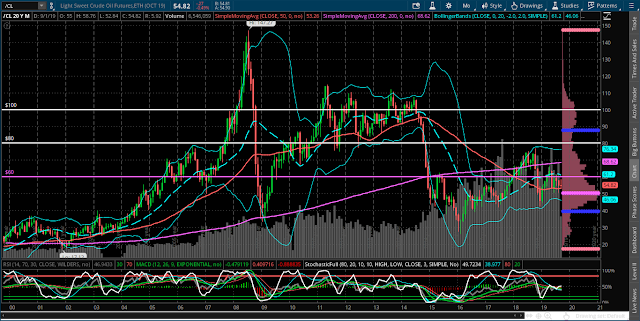
On the bottom section of the following monthly chart of CL, the ratio of Oil to its Volatility Index is shown in histogram format.
Watch for it to break and hold above 2.00, and, subsequently, 3.00 on this ratio, as well as an upside crossover of the 5 and 8 MAs, to confirm the sustainability of such a price surge.
As a side note, whether a sharp rise in Oil also drags Canada's TSX Index higher, remains to be seen. Coincidentally, I wrote about such a scenario in my post late Friday night, based on different circumstances/influences.
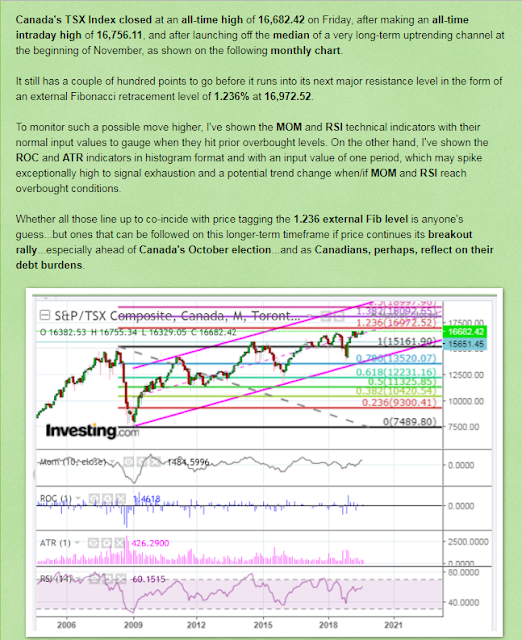
Here's an excerpt from that article (entitled "Canada's TSX, Election and Trade Fever").
* UPDATES...
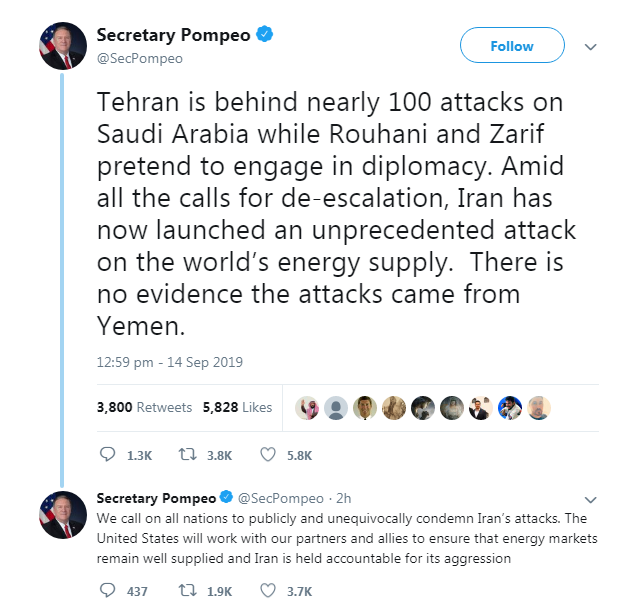
In the several hours that have passed since I posted the subject article, Secretary Pompeo has tweeted the following (he blames Iran, not Yemen, directly for the attack)...
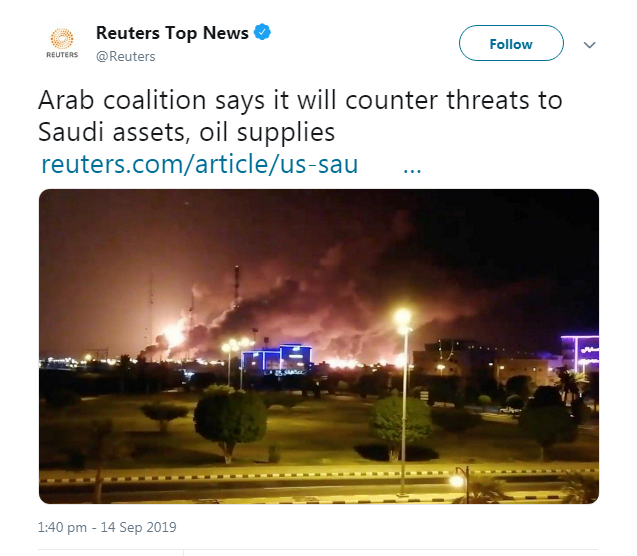
This tweet from Reuters followed (but, exactly what "necessary measures to safeguard national assets, international energy security and ensure stability of world economy" would be taken by a Saudi-led, western-backed, Sunni Muslim military alliance, remains to be seen)...
