Working out makes just about everything in my life better. I have more energy, food tastes better and (at least feel as if) I look better. I even think it makes me smarter, too.
I do not feel good about Life Time Fitness (LTM)’s stock, however. The growth expectations in the stock are much too high. And I do not believe in management’s over confident EPS guidance.
Overconfident
Reviewing the transcript of the 2Q12 conference call, management’s confidence and growth projections seemed a bit over the top for the competitive pressures on their business
First, the standalone fitness facility has a very hard time taking share from entrenched competitors such as country clubs, JCCs and YMCA centers. Given its focus and affiliation with other significant (social, religious, professional) parts of a person’s life, country clubs and YMCAs simply have a stronger draw and enjoy more loyalty. On-site office facilities offer compelling convenience at, usually, little-to-no cost.
Even after adding all the amenities of a country club or YMCA, standalone facilities like Life Time Fitness do not fare well when competing against the home gym. Work-out equipment is more accessible and cheaper than ever. More people are building or setting aside space in their homes for working out. People can save a lot of money working out at home. It is a lot more convenient. You do not have to use a communal shower or share a mirror with a professional body-builder.
In summary, Life Time Fitness’ growth faces considerable head winds.
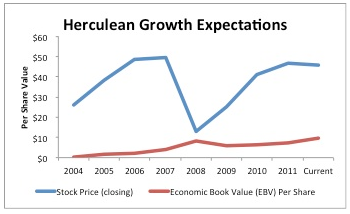
Now, let’s take a look at the growth expectations baked into the current stock price (~$45.12).

Sources: New Constructs, LLC and company filings
As highlighted in Figure 1, the ratio of stock price to economic book value is close to five, which means nearly 80% of the current stock price relies on future growth.
In discounted cash flow terms, the current stock price implies the company will grow profits at 12% compounded annually for 18 years. If we use the 15% growth rate named as the “stretch goal” on management’s 2Q12 conference call, we are looking at 15% compounded annual profit growth for 12 years to justify the current stock price.
Hard To Believe
To buy this stock, an investor must believe that the company’s growth will be significantly greater than what is already in the current stock price.
I think those growth expectations are high, and they get ludicrously high when put in the context of the member growth required to justify them. Assuming profit per member provided on the 2Q12 conference call of $1600/year, membership growth has to be:
- 20% compounded annually over 18 years or
- 28% compounded annually over 12 years
Compared to historical, organic growth of 11% over the past year, the numbers above are astronomical.
Growth Outlook
Please do not be fooled by acquisition-driven growth because that growth meaningfully lowers the cash flows of the business. Purchased members are far more expensive than organically-acquired members. Most investors do not realize this because the costs of the purchased members get buried on the balance sheet and do not affect EPS. In fact, many companies use acquisitions to overstate EPS, per the high-low fallacy. Never judge an acquisition by whether or not it is “earnings accretive”. The impact of an acquisition on a company’s accounting earnings is not indicative of its value to shareholders.
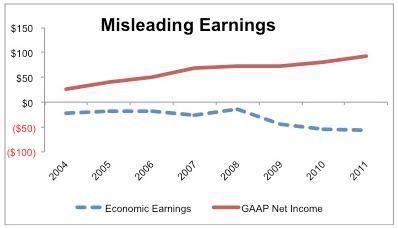
For the argument that profits are expected to rise faster than revenues, I suggest you double-check how you measure profits. Per Figure 2, the company is not as profitable as it appears to be. Over the past several years, the company’s reported earnings are diverging from their true economic earnings. 
Sources: New Constructs, LLC and company filings
Looking through the footnotes of LTM’s SEC filings since 2004, we find the main causes of the divergence are $277 million in off-balance-sheet debt and about $5 million of write-offs (after-tax).
The write-offs are more of a red flag than the off-balance-sheet debt. I think that number could get a lot larger if the company relies on acquisitions to try and meet the unrealistic expectations in its stock price. Write-downs represent the failure of management to allocate capital successfully.
Investors should sell LTM before expectations fall back to more realistic levels. LTM was a new addition to the Most Dangerous Stocks list in September.
Avoid ETFs And Mutual Funds That Hold LTM
Here is a list of the mutual funds that allocate the most to LTM and get my Dangerous-or-worse rating. I did not find any ETFs with meaningful allocations to LTM.
- Allianz Funds Multi-Strategy Trust: Allianz AGIC Focused Opportunity Fund (AFOAX, AFOIX) – Very Dangerous Rating
- Advisors’ Inner Circle Fund: Rice Hall James Mid Cap Portfolio (RHJVX) –Dangerous Rating
- Wasatch Funds Trust: Wasatch Small Cap Growth Fund (WAAEX) – Dangerous Rating
- Allianz Funds: AGIC Opportunity Fund (POOBX, POPAX) – Very Dangerous Rating
- Harbor Funds: Harbor Small Cap Value Fund (HISVX, HASCX, HSVRX) – Dangerous Rating
