Get 40% Off
🚨 Volatile Markets? Find Hidden Gems for Serious OutperformanceFind Stocks Now

Let's Look At The NASDAQ 100 Big Picture

Published 05/19/2021, 03:40 PM
Updated 07/09/2023, 06:31 AM

Over the past many months, I have kept you updated on the NASDAQ 100's smaller Elliott Wave Principle (EWP) waves using daily charts.

For example, 12 days ago, I wrote:

“If the bulls are not careful, the April 28 top could already have been the green wave-5… . Namely, if the index trades below the … 13,297 high made March 16 going forward without creating a new all-time high first, then the current decline cannot be a 4th wave any more … because in an impulse wave, 4th and 1st waves cannot overlap according to the EWP rules. Only in a diagonal is such overlap allowed. See here. [But] these are unreliable structures. Instead, I would, therefore, like to focus on … the index has completed a larger 3rd wave top and is now completing a larger 4th wave, back down to ideally around the mid-12,000s. Then one final wave-5 should commence before the index is finally ready to wrap up the rally that started March 2020 and March 2009.”

Since the regular NASDAQ had already overlapped with its March 16 high when writing my May 5 article, the NDX followed suit on May 11. Therefore, my focus on the mid-12,000s was appropriate, as the NDX is now trading at the high-12,000s to low-13,000s. Combined with last update’s “Then one final wave-5 should commence before the index is finally ready to wrap up the rally that started March 2020 and March 2009,” I have a nice lead in to my big picture review of the NDX as the index is, inn my opinion, carving out a significant top over the coming weeks to months. See Figure 1 below.

3rd party Ad. Not an offer or recommendation by Investing.com. See disclosure here or remove ads .

Figure 1 NDX 100 monthly candlestick chart with EWP count and technical indicators.
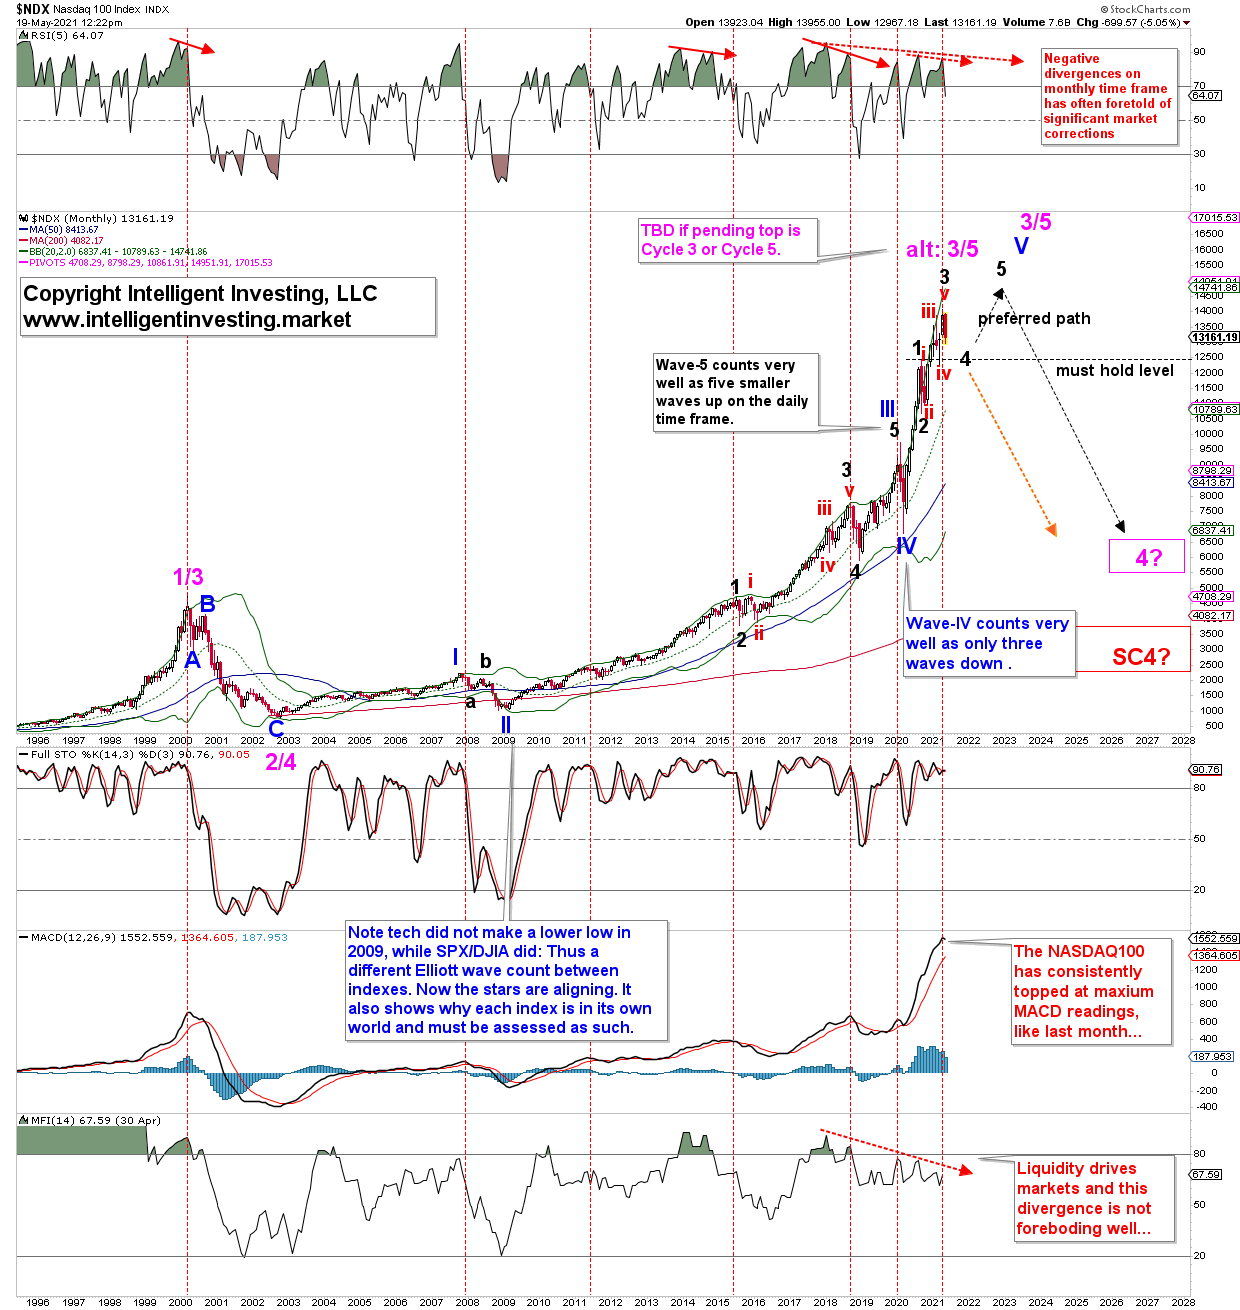
NASDAQ 100 Monthly Chart.

Figure 1 contains a lot of information, so please take your time to digest it. There are several warning signs from a technical indicators’ perspective. From the top to the bottom of the chart:

  1. The monthly RSI5 is negatively divergence: higher prices on less strength (dotted red arrows). In the past, this always leads to deep corrections or even a bear market (solid red arrows).
  2. The index topped on maximum MACD readings both for significant corrections and the 2000-2002 bear market. The MACD topped recently (dotted red vertical lines).
  3. The Money Flow Index (MFI14) monitors liquidity and (despite the Fed’s massive firehose of late) it last peaked in late-2017. Liquidity drives markets, and when it dries up, it means buying pressure is subsiding. And when buying dries up, only selling is left.

Although divergence is only divergence until it is not, the many instances where it mattered in the past must give any trader and investor pause and assess the current upside potential versus downside risk from the short to the long term.

From an EWP perspective, it is yet unclear if the 2000 high was Cycle wave-1 or Cycle-3. If the former, then the pending top is Cycle-3, and the subsequent correction “only” a Cycle-4 wave should bring the index back to the most around the 2018-2020 lows (purple box). It cannot overlap with the 2000 high. If it does, then the 2000 high was a Cycle-3 wave, the 2002 low a Cycle-4 low, and the top, now or a bit later, Cycle-5 of Super Cycle-III. The ensuing bear market will then be of the same degree as the 1929-1932 bear market and, ideally, bring the price back to the price levels last since in the early-2000s (red box).

3rd party Ad. Not an offer or recommendation by Investing.com. See disclosure here or remove ads .

Either way, the index must hold the March 2021 lows as we advance to allow for the preferred path to unfold (black dotted arrows). If it cannot maintain those levels, then the NDX will enter a multi-year bear market (orange arrow), either the Cycle-4 or Super Cycle-IV wave. In a bull market, a 3rd wave is always followed by a 4th wave, which is then followed by a 5th wave. Thus, the index is now simply running out of waves, and the technical indicators are starting to confirm this.

Note, the chart is on the monthly timeframe, and all divergences I pointed out are, therefore, of even more significance than those on a daily chart.

Latest comments

Surely it must at least hold the May 2021 lows to advance further?
Did you mean that the Nasdaq100 started its final leg and rally here (or anytime), or did I understand you correctly in that something was lacking on the downside first?
The excess of volatility creating all the noise is making this difficult. However, it seems likely that the Nasdaq100 might want to come down to about 12500 (6%) and test this level. In the same context the DAX would fall about 5% to 14500. What would occur here, I dunno. There are lows beyond, or the market finds strength, or the final move up can even be a failure (second chance) in view of some actors seeing a weaker future.
Great article. Wow, when you put it this way, looks like some scary price action on the way. Hedge accordingly.
Question, Why chart NDX and Not IXIC? I notice the DOW fell through a rising wedge today and even though it bounced off the 50ma I think it is the start of a correction for the Dow. Is there anyways the Nasdaq could survive a 10% correction from the dow?Appreciate your work.
nothing
I tend to agree with you, Leon. Yet bearing in mind that a stretched market often gets 'a second chance', but which except in the case of a irregular correction (second retracement) means a lower top.
If we are thinking the same, the DJIA seems to have completed either a wave 2 or B, which is a sideways zig-zag, which would if correct be followed either by a wave 3 or C - but in either case a 1.618 ratio of wave 1 or A is the most rational checkpoint which would extend some 2250 points to the downside and test the 32100 region. Nasdaq follows suit.
i appreciate your efforts to explain the often complex workings of the market. however even a person of modest intelligence should be able to take one look at that chart and think ... hmm, it looks like its shot up an awful lot lately and is now many times higher than it was just a couple of years ago. that doesnt seem sustainable. of course if one happens to be a narcissist with a god complex who is fueled primarily by greed and self importance its possible to miss it.
agree
Risk Disclosure: Trading in financial instruments and/or cryptocurrencies involves high risks including the risk of losing some, or all, of your investment amount, and may not be suitable for all investors. Prices of cryptocurrencies are extremely volatile and may be affected by external factors such as financial, regulatory or political events. Trading on margin increases the financial risks.
Before deciding to trade in financial instrument or cryptocurrencies you should be fully informed of the risks and costs associated with trading the financial markets, carefully consider your investment objectives, level of experience, and risk appetite, and seek professional advice where needed.
Fusion Media would like to remind you that the data contained in this website is not necessarily real-time nor accurate. The data and prices on the website are not necessarily provided by any market or exchange, but may be provided by market makers, and so prices may not be accurate and may differ from the actual price at any given market, meaning prices are indicative and not appropriate for trading purposes. Fusion Media and any provider of the data contained in this website will not accept liability for any loss or damage as a result of your trading, or your reliance on the information contained within this website.
It is prohibited to use, store, reproduce, display, modify, transmit or distribute the data contained in this website without the explicit prior written permission of Fusion Media and/or the data provider. All intellectual property rights are reserved by the providers and/or the exchange providing the data contained in this website.
Fusion Media may be compensated by the advertisers that appear on the website, based on your interaction with the advertisements or advertisers.
© 2007-2024 - Fusion Media Limited. All Rights Reserved.