
Legg Mason Inc. (NYSE:LM) reported positive earnings surprise of 53.5% in first-quarter fiscal 2018 (ended Jun 30). The company reported adjusted net income of 66 cents per share, considerably beating the Zacks Consensus Estimate of 43 cents. However, results compared unfavorably with 79 cents recorded in the prior-year quarter.
Solid top-line performance and steady assets under management (AUM) were the tailwinds. However, escalating expenses remain a concern.
Including one-time items, Legg Mason reported net income of $50.9 million or 52 cents per share compared with $33.5 million or 31 cents in the year-ago quarter.
Revenue Rises, Expenses Flare Up
Legg Mason’s total operating revenue in the quarter came in at $793.8 million, up 13.4% year over year. The upsurge was mainly due to elevated average long term AUM and performance fees, along with revenues associated with the addition of Clarion and EnTrust. In addition, revenues outpaced the Zacks Consensus Estimate of $779.2 million.
Investment advisory fees increased 17.4% year over year to $713.7 million in the quarter. Additionally, other revenues climbed 10% year over year to $1.1 million. However, distribution and service fees were down 13.7% year over year to $78.9 million.
Operating expenses increased 10.0% to $686.6 million on a year-over-year basis. The rise was chiefly due to higher compensation and benefits (up 15.3%), and expenses related to impairment of intangible assets.
Adjusted operating margin of Legg Mason was 22.5%, significantly up from 11.3% in the prior-year quarter. Lower acquisition and transition-related costs led to the rise.
Solid Assets Position
As of Jun 30, 2017, Legg Mason’s AUM was $741.2 billion, down slightly year over year from $741.9 billion. Of the total AUM, fixed income constituted 55%, equity 26%, liquidity 10% and alternatives represented 9%.
AUM inched up 1.8% sequentially from $728.4 billion as of Mar 31, 2017, driven by positive market performance of $8.4 billion, long-term net inflows of $0.5 billion and $0.7 billion in positive foreign exchange. These positives were partially offset by liquidity outflows of $11.5 billion. Notably, change in category of $16.0 billion of separately managed account assets which were previously classified as Assets Under Advisement also positively impacted AUM.
Notably, long-term net inflows of $0.5 billion included equity inflows of $1.0 billion and fixed income inflows of $0.3 billion, partially mitigated by alternative outflows of $0.8 billion. Additionally, average AUM was $740.3 billion compared with $709.1 billion in the prior-year quarter and $718.9 billion in the prior quarter.
Strong Balance Sheet
As of Jun 30, 2017, Legg Mason had $491 million in cash. Total debt was $2.2 billion, while shareholders’ equity came in at $4.0 billion.
The ratio of total debt to total capital (total equity plus total debt excluding consolidated investment vehicles) was 36%, in line with the prior quarter.
Capital Deployment Update
Legg Mason repurchased 2.4 million shares at a total cost of $90 million in the reported quarter, while 0.3 million shares at a total cost of $12 million were repurchased under net share settlements of annual deferred compensation award vesting.
Our Viewpoint
We believe Legg Mason has the potential to outperform its peers over the long run, given its diversified product mix and leverage in the changing market demography. Further, with strategic acquisitions, restructuring initiatives and cost-cutting measures, we anticipate operating efficiencies to improve. Also, steady capital deployment activities continue to boost investors’ confidence in the stock. However, escalating expenses remain a key concern.
Legg Mason, Inc. Price, Consensus and EPS Surprise
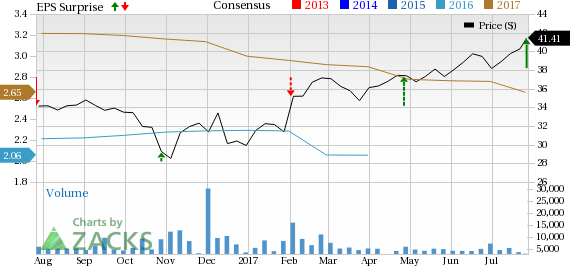
Legg Mason, Inc. Price, Consensus and EPS Surprise | Legg Mason, Inc. Quote
Legg Mason currently carries a Zacks Rank #3 (Hold). You can see the complete list of today’s Zacks #1 Rank (Strong Buy) stocks here.
Competitive Landscape
T. Rowe Price Group, Inc. (NASDAQ:TROW) reported positive earnings surprise of 0.8% for second-quarter 2017. Adjusted earnings per share of $1.28 outpaced the Zacks Consensus Estimate by a penny. Further, the bottom line improved 15.3% from the year-ago figure of $1.11.
Ameriprise Financial Inc.’s (NYSE:AMP) second-quarter 2017 operating earnings per share of $2.80 comfortably surpassed the Zacks Consensus Estimate of $2.62. Also, the figure represents a year-over-year increase of 26%.
The Blackstone Group L.P. (NYSE:BX) reported second-quarter 2017 economic net income (ENI (MI:ENI)) of 59 cents per share, which lagged the Zacks Consensus Estimate of 62 cents. An increase in expenses was the primary reason for the lower-than-expected results. However, the quarter witnessed a rise in revenues.
More Stock News: Tech Opportunity Worth $386 Billion in 2017
From driverless cars to artificial intelligence, we've seen an unsurpassed growth of high-tech products in recent months. Yesterday's science-fiction is becoming today's reality. Despite all the innovation, there is a single component no tech company can survive without. Demand for this critical device will reach $387 billion this year alone, and it's likely to grow even faster in the future.
Zacks has released a brand-new Special Report to help you take advantage of this exciting investment opportunity. Most importantly, it reveals 4 stocks with massive profit potential. See these stocks now>>
T. Rowe Price Group, Inc. (TROW): Free Stock Analysis Report
Legg Mason, Inc. (LM): Free Stock Analysis Report
AMERIPRISE FINANCIAL SERVICES, INC. (AMP): Free Stock Analysis Report
The Blackstone Group L.P. (BX): Free Stock Analysis Report
Original post