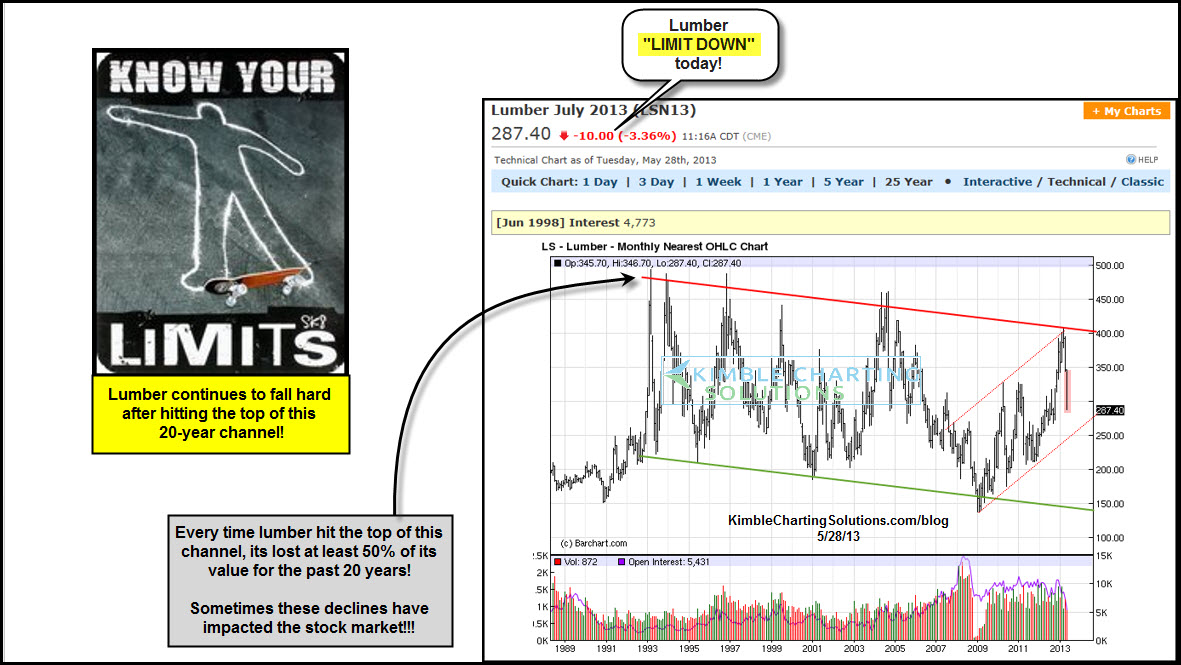
The Power of the Pattern reflected that a key economic asset, Lumber, could fall 50% in value back on 3/18, due to 20-year channel resistance and 75% bulls. (see here)
Lumber was trading at $385 at the time, while today Lumber is limit down trading at $287, losing 25% of its value in 70 days!
The above chart reflects that 100% of the time that Lumber hit the top of its trading channel, it has fallen at least 50% in value, over and over for the past 20 years. I doubt that many of you trade Lumber and many of you might be saying,"why should I care about Lumber, I don't own it."
Let's look at Lumber a little more closely: The bottom of the channel was hit in 1995, 2001 and 2009, not bad times to be looking to buy stocks at low prices. The last serious decline by Lumber took place in early 2011. What did the S&P 500 do after this Lumber decline? SPY declined 17%, peaking in May of 2011.
Lumber is not the "Holy Grail" of stock market indicators, yet oftentimes it has paid to respect it at the top and bottom of this 20-year channel and its message for the stock market.
- English (UK)
- English (India)
- English (Canada)
- English (Australia)
- English (South Africa)
- English (Philippines)
- English (Nigeria)
- Deutsch
- Español (España)
- Español (México)
- Français
- Italiano
- Nederlands
- Português (Portugal)
- Polski
- Português (Brasil)
- Русский
- Türkçe
- العربية
- Ελληνικά
- Svenska
- Suomi
- עברית
- 日本語
- 한국어
- 简体中文
- 繁體中文
- Bahasa Indonesia
- Bahasa Melayu
- ไทย
- Tiếng Việt
- हिंदी
Leading Indicator Loses 25% Of Its Value In 70 Days
Published 05/29/2013, 12:14 AM
Updated 07/09/2023, 06:31 AM
Leading Indicator Loses 25% Of Its Value In 70 Days
Latest comments
Install Our App
Risk Disclosure: Trading in financial instruments and/or cryptocurrencies involves high risks including the risk of losing some, or all, of your investment amount, and may not be suitable for all investors. Prices of cryptocurrencies are extremely volatile and may be affected by external factors such as financial, regulatory or political events. Trading on margin increases the financial risks.
Before deciding to trade in financial instrument or cryptocurrencies you should be fully informed of the risks and costs associated with trading the financial markets, carefully consider your investment objectives, level of experience, and risk appetite, and seek professional advice where needed.
Fusion Media would like to remind you that the data contained in this website is not necessarily real-time nor accurate. The data and prices on the website are not necessarily provided by any market or exchange, but may be provided by market makers, and so prices may not be accurate and may differ from the actual price at any given market, meaning prices are indicative and not appropriate for trading purposes. Fusion Media and any provider of the data contained in this website will not accept liability for any loss or damage as a result of your trading, or your reliance on the information contained within this website.
It is prohibited to use, store, reproduce, display, modify, transmit or distribute the data contained in this website without the explicit prior written permission of Fusion Media and/or the data provider. All intellectual property rights are reserved by the providers and/or the exchange providing the data contained in this website.
Fusion Media may be compensated by the advertisers that appear on the website, based on your interaction with the advertisements or advertisers.
© 2007-2024 - Fusion Media Limited. All Rights Reserved.
