
Lazard Ltd. (NYSE:LAZ) reported a decline of 6.9% in preliminary assets under management (AUM) as of Feb 29, 2020 from the prior month. Total AUM came in at $226.8 billion, down from the January 2020 figure of $243.6 billion.
February AUM displayed $14-billion market depreciation, net outflows of $0.9 billion and unfavorable foreign-exchange impact of $1.9 billion.
Lazard’s equity AUM at the end of February fell 8% from the previous month to $184 billion. Further, other assets declined 2.2% to $4.4 billion. Fixed income AUM decreased slightly on a sequential basis to $38.4 billion.
Our Viewpoint
Lazard is well poised to grow organically, driven by strength in Financial Advisory and Asset Management segments. However, absence of continued growth in equity markets owing to the coronavirus crisis and stringent regulations remain headwinds.
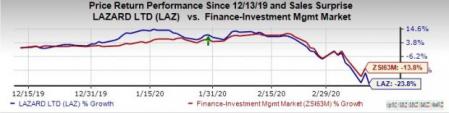
The stock has lost around 23.8% in the past three months compared with the industry’s decline of 13.8%.
Lazard currently sports a Zacks Rank #1 (Strong Buy). You can see the complete list of today’s Zacks #1 Rank stocks here.
Competitive Landscape
Among other investment managers, Invesco (NYSE:IVZ) announced its AUM for February 2020. The company’s preliminary month-end AUM of $1,159.4 billion represents a decline of 4.9% from the previous month. The decline can be attributed to unfavorable market returns, net long-term outflows and net outflows in money market AUM, partly offset by net inflows in non-management fee earning AUM and reinvested distributions. Further, unfavorable foreign-exchange movement resulted in a fall in the monthly AUM by $3.9 billion.
Franklin Resources (NYSE:BEN) announced preliminary AUM by its subsidiaries of $656.5 billion for February 2020. Results reflected a 4.6% decrease from $688 billion recorded as of Jan 31, 2020. Net outflows and negative market returns led to the decline. Further, the reported figure dropped 8.1% year on year.
LPL Financial Holdings Inc.’s (NASDAQ:LPLA) total brokerage and advisory assets of $736.6 billion at the end of February 2020 declined 4% from the prior month but increased 9% year over year. Of the total brokerage and advisory assets, brokerage assets were $380.9 billion, while advisory assets totaled $355.7 billion. The sequential decline resulted from lower equity markets, including a decline of 8.4% in the S&P 500 Index.
The Hottest Tech Mega-Trend of All
Last year, it generated $24 billion in global revenues. By 2020, it's predicted to blast through the roof to $77.6 billion. Famed investor Mark Cuban says it will produce "the world's first trillionaires," but that should still leave plenty of money for regular investors who make the right trades early.
See Zacks' 3 Best Stocks to Play This Trend >>
Franklin Resources, Inc. (BEN): Free Stock Analysis Report
Lazard Ltd (LAZ): Free Stock Analysis Report
Invesco Ltd. (IVZ): Free Stock Analysis Report
LPL Financial Holdings Inc. (LPLA): Free Stock Analysis Report
Original post
Zacks Investment Research