
Lam Research Corporation (NASDAQ:LRCX) reported second-quarter fiscal 2018 non-GAAP earnings of $4.34 per share, surpassing the Zacks Consensus Estimate of $3.69. Earnings increased 26% sequentially and 94% year over year.
During the quarter, management said that it expects record levels of customer equipment spending in 2018, driving profits for the company.
Also, the company said that strong demand for bit growth in server DRAM and NAND will continue to expand, driven by cloud computing and IoT, creating more opportunities for Lam Research in the near future.
Lam Research continues to witness increased adoption rates of 3D NAND technology, FinFETs and multi-patterning. The company has taken cost-reduction activities and density scaling for 3D NAND and new memory technologies.
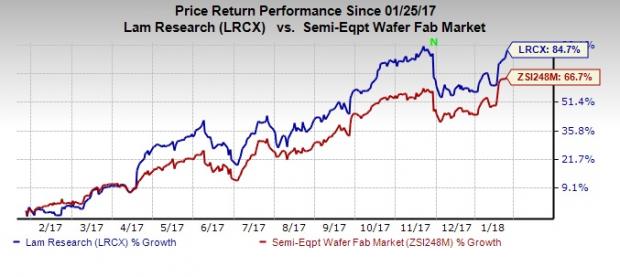
The stock increased 3.90% in after-hours trading, driven by better-than-expected second-quarter revenues and earnings figures. Also, on a 12-month basis, the stock has outperformed the industry it belongs to. It has increased 84.7% compared with the industry’s growth of 66.7%.
 Revenues
Revenues of $2.58 billion increased 4.1% sequentially and 37.1% year over year. Also, revenues came in above the Zacks Consensus Estimate of $2.56 billion.
Revenues by Geography
Region wise, Korea contributed 30%, Japan accounted for 16% and Taiwan accounted for 15% of second-quarter revenues. The United States, China and Southeast Asia each generated 11%, while Europe managed 6%.
Shipments
Total system shipments were $2.63 billion during the reported quarter, up 11% from $2.38 billion reported in the last quarter. However, shipments were above the Zacks Consensus Estimate of $2.61 billion.
Margins
Non-GAAP gross profit was $1.23 billion or 47.6% of revenues, reflecting an increase of 40 bps sequentially.
Total adjusted operating expenses were $448.7 million, reflecting an increase of 3% sequentially. Operating margin was 30.2%, increasing 60 bps from the prior quarter.
Net Income
GAAP net loss was $10 million compared with $590.7 million in the last quarter and $332.8 million in the year-ago quarter.
Non-GAAP net income was $787.9 million compared with $627.8 million in the last quarter.
Balance Sheet
Exiting second-quarter fiscal 2018, cash and cash equivalents, short-term investments, and restricted cash and investment balances were $5.7 billion compared with $6.2 billion at the end of first-quarter fiscal 2018.
Cash flow from operating activities was $28.7 million and capital expenditures amounted to $84.7 million. The company paid $73.0 million in cash dividends and spent approximately $1,111 million on share repurchases.
Guidance
Lam Research provided guidance for third-quarter fiscal 2018.
On a non-GAAP basis, the company expects revenues of approximately $2.850 billion (+/- $125 million). The Zacks Consensus Estimate is pegged at $2.66 billion. Shipments are projected to be around $3.175 billion (+/- $125 million). Gross margin is predicted at around 46% (+/-1%), while operating margin is likely to be about 29% (+/-1%).
Earnings per share are projected at $4.35 (+/- 15 cents) on a share count of nearly 181 million. The Zacks Consensus Estimate is pegged at $3.81 per share, which makes guidance better than expected. GAAP earnings per share are projected at $4.10 (+/- 15 cents).
Lam Research Corporation Price, Consensus and EPS Surprise
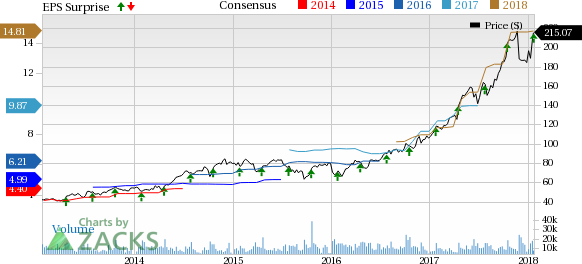
Lam Research Corporation Price, Consensus and EPS Surprise | Lam Research Corporation Quote
Stocks to Consider
Currently, Lam Research has a Zacks Rank #2 (Buy). A few better-ranked stocks in the broader technology sector are PetMed Express (NASDAQ:PETS) , sporting a Zacks Rank #1 (Strong Buy), and ASML Holding (AS:ASML) N.V. (NASDAQ:ASML) and Applied Materials (NASDAQ:AMAT) , with a Zacks Rank #2 each. You can see the complete list of today’s Zacks #1 Rank stocks here.
Long-term earnings per share growth rate for PetMed Express, ASML Holding and Lam Research is projected to be 10%, 18.7% and 12.7%, respectively.
Today's Stocks from Zacks' Hottest Strategies
It's hard to believe, even for us at Zacks. But while the market gained +18.8% from 2016 - Q1 2017, our top stock-picking screens have returned +157.0%, +128.0%, +97.8%, +94.7%, and +90.2% respectively.
And this outperformance has not just been a recent phenomenon. Over the years it has been remarkably consistent. From 2000 - Q1 2017, the composite yearly average gain for these strategies has beaten the market more than 11X over. Maybe even more remarkable is the fact that we're willing to share their latest stocks with you without cost or obligation.
PetMed Express, Inc. (PETS): Free Stock Analysis Report
ASML Holding N.V. (ASML): Free Stock Analysis Report
Lam Research Corporation (LRCX): Free Stock Analysis Report
Applied Materials, Inc. (AMAT): Free Stock Analysis Report
Original post