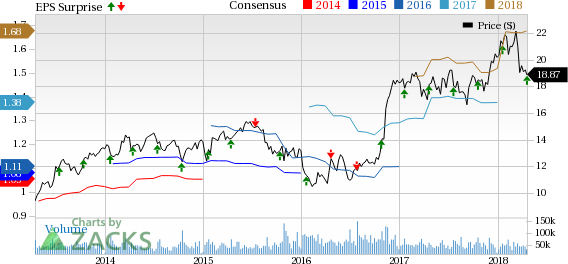
KeyCorp’s (NYSE:KEY) first-quarter 2018 earnings of 38 cents per share came in line with the Zacks Consensus Estimate. Also, this compared favorably with adjusted earnings of 32 cents per share recorded in the prior-year quarter.
Improvement in both net interest income and fee income drove results. Further, a decline in provision for credit losses and improving loans acted as tailwinds. However, an increase in expenses was on the downside.
Net income from continuing operations was $402 million, up from $296 million registered in the prior-year quarter.
Revenues Improve, Expenses Rise
Total revenues grew 3.1% year over year to $1.55 billion. However, the figure marginally lagged the Zacks Consensus Estimate of $1.56 billion.
Tax-equivalent net interest income went up 2.5% year over year to $952 million. The rise was attributable to benefits from low deposit betas and elevated interest rates. Also, taxable-equivalent net interest margin from continuing operations improved 2 basis points (bps) year over year to 3.15%.
Non-interest income was $601 million, reflecting an increase of 4.2% from the year-ago quarter. The increase was driven by an improvement in all components except trust and investment services income, cards and payments income along with other income.
Non-interest expenses (excluding notable items) increased 7.9% year over year to $1.01 billion. The rise was due to higher personnel costs, largely due to recent acquisitions as well as accelerated technology investments and higher performance-based compensation.
Strong Balance Sheet
At the end of the first quarter, average total deposits were $102.56 billion, down 1.2% from the prior quarter. Average total loans were $86.93 billion, up 1.1% sequentially.
Credit Quality: A Mixed Bag
Net loan charge-offs, as a percentage of average loans, decreased 2 bps year over year to 0.25%. Provision for credit losses declined 3.2% year over year to $61 million.
Further, non-performing assets, as a percentage of period-end portfolio loans, other real estate owned properties assets and other nonperforming assets were 0.65%, down 7 bps year over year.
However, KeyCorp’s allowance for loan and lease losses was $881 million, up 1.3% from the prior-year quarter.
Capital Position
KeyCorp's tangible common equity to tangible assets ratio was 8.22% as of Mar 31, 2018, down from 8.51% as of Mar 31, 2017. However, Tier 1 risk-based capital ratio was 10.84%, up from 10.74% as of Mar 31, 2017.
The company’s estimated Basel III Common Equity Tier 1 ratio was 9.88% at the end of the quarter.
Share Repurchases
During the reported quarter, KeyCorp repurchased $199 million worth of shares as part of its 2017 capital plan.
Our Take
KeyCorp remains well positioned for growth in revenues, given rising rate environment and rise in loan and deposit balances. Improving credit quality and enhanced capital deployment activities are the other positives. Further, the corporate tax rate cut will aid profitability to some extent. However, persistently increasing expenses, owing to investments in franchise and acquisitions, are likely to hurt bottom-line growth. Further, the company's significant exposure toward risky loan portfolios remains a major concern.
KeyCorp currently carries a Zacks Rank #3 (Hold). You can see the complete list of today’s Zacks #1 Rank (Strong Buy) stocks here.
Performance of Other Banks and Upcoming Release
Despite dismal investment banking performance, higher interest rates, trading rebound and tax cuts drove Bank of America’s (NYSE:BAC) first-quarter 2018 earnings of 62 cents per share, which outpaced the Zacks Consensus Estimate of 59 cents. Net interest income growth, higher card income and impressive equity trading income supported revenues. Operating expenses recorded a decline. Additionally, provision for credit losses remained stable.
Comerica Inc. (NYSE:CMA) reported adjusted earnings per share of $1.54 in first-quarter 2018, up from the prior-year quarter adjusted figure of $1.02 on high interest income. The Zacks Consensus Estimate was $1.49. Higher revenues and improved credit metrics were recorded. Moreover, rise in loans was another tailwind. Nonetheless, lower deposits and rise in expenses were undermining factors.
SunTrust Banks, Inc. (NYSE:STI) is scheduled to report earnings on Apr 20.
The Hottest Tech Mega-Trend of All
Last year, it generated $8 billion in global revenues. By 2020, it's predicted to blast through the roof to $47 billion. Famed investor Mark Cuban says it will produce "the world's first trillionaires," but that should still leave plenty of money for regular investors who make the right trades early.
See Zacks' 3 Best Stocks to Play This Trend >>
Comerica Incorporated (CMA): Free Stock Analysis Report
SunTrust Banks, Inc. (STI): Free Stock Analysis Report
KeyCorp (KEY): Free Stock Analysis Report
Bank of America Corporation (BAC): Free Stock Analysis Report
Original post
Zacks Investment Research

