
Keryx Biopharmaceuticals, Inc. (NASDAQ:KERX) incurred a loss of 12 cents per share (excluding $2.2 million in non-cash interest expenses related to the amortization of a discount recognized in connection with the modification of the convertible senior notes) in the third quarter of 2018, narrower than Zacks Consensus Estimate of a loss of 13 cents. The loss was also narrower than the year-ago loss of 20 cents.
Revenues came in at $28 million in the reported quarter, missing the Zacks Consensus Estimate of $30 million but up from the prior-year quarter’s $15 million.
Keryx’s top line comprises revenues generated by its only marketed product Auryxia (ferric citrate). The drug is approved in the United States to control serum phosphorus levels in adults with chronic kidney disease (CKD) on dialysis. In September 2015, Keryx gained an EU approval for Fexeric (EU trade name for Auryxia) for the control of elevated serum phosphorus levels or hyperphosphatemia in adult patients with CKD including dialysis and non-dialysis dependent CKD.
In November 2017, the FDA granted an approval for an additional indication of Auryxia to treat adults with iron deficiency anemia (IDA) as well as chronic kidney disease, not on dialysis. The approval is boosting the company’s sales, given the IDA market’s great potential.
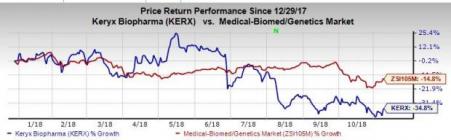
The stock has lost 34.8% year to date, underperforming the industry’s decline of 14.8%.
Quarter in Detail
Auryxia’s net product sales in the United States totaled $26.6 million, up 96% from $13.6 million in the prior-year quarter.
Auryxia’s prescription increased to 47,500 in the quarter, representing 9.4 million Auryxia tablets compared with about 25,200 prescriptions and 5.4 million Auryxia tablets in the third quarter of 2017.
During the quarter under consideration, more than 2000 additional physicians prescribed Auryxia compared with what was prescribed in the prior-year quarter.
There was a shift in channel mix for Auryxia during the third quarter of 2018, with 61% of prescriptions coming through IMS reporting channels and 39% coming through specialty pharmacies. The shift in mix is due to the closing of Davita’s specialty pharmacy business in September 2018.
Keryx recorded license revenues of $1.4 million during the third quarter, up 3.4% year over year.
Research and development expenses declined 14.9% to $7.8 million in the quarter.
Selling, general and administrative expenses were $26.5 million in the third quarter, up 16.3% from the year-earlier period’s figure of $22.7 million.
In June, Keryx signed a definitive merger agreement with Akebia Therapeutics (AKBA) to combine in an all-stock consideration. The deal is expected to close by the end of 2018, subject to shareholder’s approval and customary closing conditions. The merger is intended to create a fully integrated renal company with a complementary portfolio, comprising Keryx’s Auryxia and Akebia’s product candidate, Vadadustat.
Keryx Biopharmaceuticals, Inc. Price, Consensus and EPS Surprise
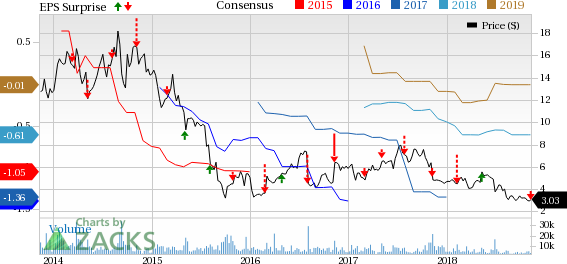
Keryx Biopharmaceuticals, Inc. Price, Consensus and EPS Surprise | Keryx Biopharmaceuticals, Inc. Quote
Zacks Rank & Stocks to Consider
Keryx carries a Zacks Rank #3 (Hold).
Some top-ranked stocks worth considering are Bristol-Myers Squibb Co. (NYSE:BMY) , Eli Lilly and Co. (NYSE:LLY) and Merck & Co. Inc. (NYSE:MRK) . While Bristol-Myers sports a Zacks Rank #1 (Strong Buy), Lilly and Merck carry a Zacks Rank #2 (Buy). You can see the complete list of today’s Zacks #1 Rank stocks here.
Bristol-Myers’ earnings per share estimates have increased from $3.59 to $3.84 for 2018 and from $3.83 to $4.07 for 2019 over the past 60 days. The company delivered a positive earnings surprise in all of the trailing four quarters with an average beat of 11.99%.
Lilly’s earnings per share estimates have increased from $5.42 to $5.51 for 2018 and from $5.69 to $5.79 for 2019 over the past 60 days. The company delivered a positive earnings surprise in all of the trailing four quarters with an average beat of 10.03%. Shares of the company have increased 30.4% year to date.
Merck’s earnings per share estimates have increased from $4.26 to $4.34 for 2018 and from $4.58 to $4.71 for 2019 over the past 60 days. The company delivered a positive earnings surprise in all of the trailing four quarters with an average beat of 3.96%. Shares of the company have increased 34.1% year to date.
The Hottest Tech Mega-Trend of All
Last year, it generated $8 billion in global revenues. By 2020, it's predicted to blast through the roof to $47 billion. Famed investor Mark Cuban says it will produce "the world's first trillionaires," but that should still leave plenty of money for regular investors who make the right trades early.
See Zacks' 3 Best Stocks to Play This Trend >>
Merck & Co., Inc. (MRK): Free Stock Analysis Report
Eli Lilly and Company (LLY): Free Stock Analysis Report
Bristol-Myers Squibb Company (BMY): Free Stock Analysis Report
Keryx Biopharmaceuticals, Inc. (KERX): Free Stock Analysis Report
Original post
Zacks Investment Research