
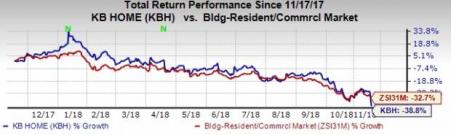
Shares of KB Home (NYSE:KBH) decreased 15.3% yesterday, after the company trimmed its guidance for fourth-quarter fiscal 2018. It also underperformed the industry in a year’s time. The stock has lost 38.8% compared with the industry’s 32.7% decline.
For fourth-quarter fiscal 2018, the company expects revenues to be between $1.31 billion and $1.34 billion, down from the prior estimate of $1.39 billion and $1.45 billion. This downside can be attributed to decrease in deliveries in Texas, lower-than-expected spec sales and potential delayed closings in California due to wildfires.
Moreover, rising labor costs might mar KB Home’s growth prospective as it limits home builders’ pricing power. Also, land prices are increasing owing to limited availability. The recently imposed tariff on imported steel and aluminum is an added concern.
Further, the Zacks Rank #3 (Hold) company expects average selling price (ASP) to be in the range of $395,000-$400,000 compared with $400,000-$405,000. Homebuilding operating margin (excluding the impact of any inventory-related charges) is anticipated to be 9.3-9.5%.
These apart, KB Home issued guidance for fiscal 2019. It expects revenues to be in the range of $4.7-$5.2 billion. The Zacks Consensus Estimate is pegged at $5.01 billion. Average selling price is projected to be between $390,000 and $400,000.
Domino Effect
The stock market runs on sentiment. Any unforeseen event in a particular sector has a ripple effect on others with a clear reflection on major indices. The case is more or less the same for specific sectors that often witness good or bad performance by one player influencing the performance of others. While major indices — Dow Jones Industrial Average, Nasdaq and S&P 500 ended the trading session on a positive note, the SPDR S&P Homebuilders ETF (NYSE:XHB) fell 0.9%.
Stocks such as Lennar Corporation (NYSE:LEN) , Toll Brothers, Inc. (NYSE:TOL) and D.R. Horton, Inc. (NYSE:DHI) , which belong to the same industry, also declined 5%, 5.9% and 2.6%, respectively.
You can see the complete list of today’s Zacks #1 Rank (Strong Buy) stocks here.
Today's Stocks from Zacks' Hottest Strategies
It's hard to believe, even for us at Zacks. But while the market gained +21.9% in 2017, our top stock-picking screens have returned +115.0%, +109.3%, +104.9%, +98.6%, and +67.1%.
And this outperformance has not just been a recent phenomenon. Over the years it has been remarkably consistent. From 2000 - 2017, the composite yearly average gain for these strategies has beaten the market more than 19X over. Maybe even more remarkable is the fact that we're willing to share their latest stocks with you without cost or obligation.
KB Home (KBH): Free Stock Analysis Report
Lennar Corporation (LEN): Free Stock Analysis Report
D.R. Horton, Inc. (DHI): Free Stock Analysis Report
Toll Brothers Inc. (TOL): Free Stock Analysis Report
Original post
Zacks Investment Research