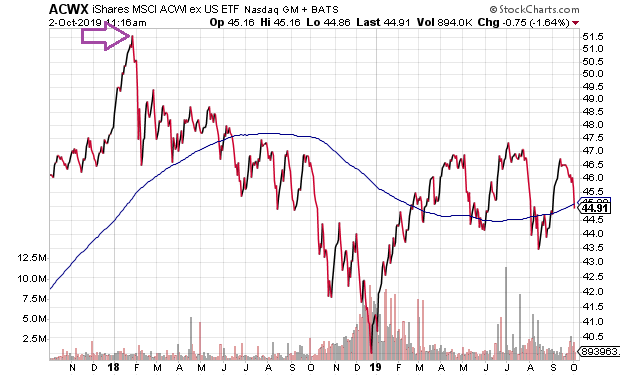
Six weeks ago, I made the case that the “ex-U.S.” stock bear began in January of 2018. It was a relatively easy case to make. After all, the iShares MSCI ACWI ex US (NASDAQ:ACWX) fell more than 20% from its all-time high and has yet to recover.
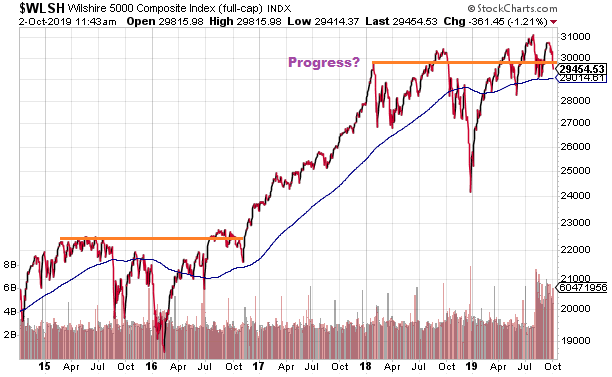
Even though the S&P 500 and the Dow did not fall 20% from their January 2018 peak, there has been minimal stock progress across 20 months. The Wilshire 5000 provides clear evidence that the entire U.S. stock market has been trending sideways in much the same way that it did during the 2015-2016 manufacturing recession.
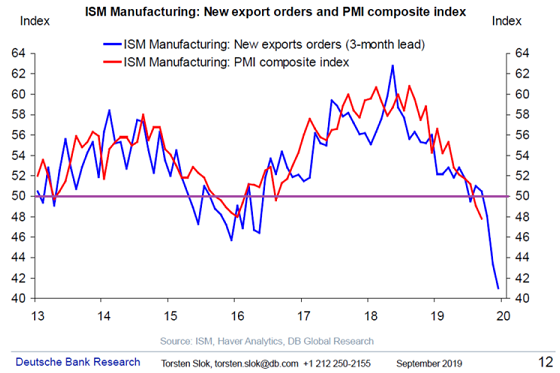
Interestingly enough, we are experiencing yet another manufacturing recession here in 2019. Not only is the ISM’s PMI composite the furthest below the expansion mark (50) since the Great Recession, but new export orders have collapsed altogether.
Bullish stock investors seem to think that there’s little reason to fret. The manufacturing downturn of 2015-2016 had been confined to the energy space and, eventually, stocks rocketed higher.
Lost in the retelling, however, stocks did not rocket skyward until two significant stimulus prospects came into the picture. Trump’s promise of dramatically lower corporate taxes served as a monumental boost in November of 2016, as Republicans took control of both the White House and Congress. Equally important, the European Central Bank (ECB) and others around the globe embarked on their most ambitious quantitative easing (QE) stimulus package(s) to date.
Here in 2019, though, there may not be enough global monetary stimulus or domestic fiscal stimulus available. At least not enough to benefit stocks in a meaningful manner. The Fed is debating one-quarter point reductions in the Fed Funds rate, which is unlikely to do the trick. And the ECB may already be near the end of the line.
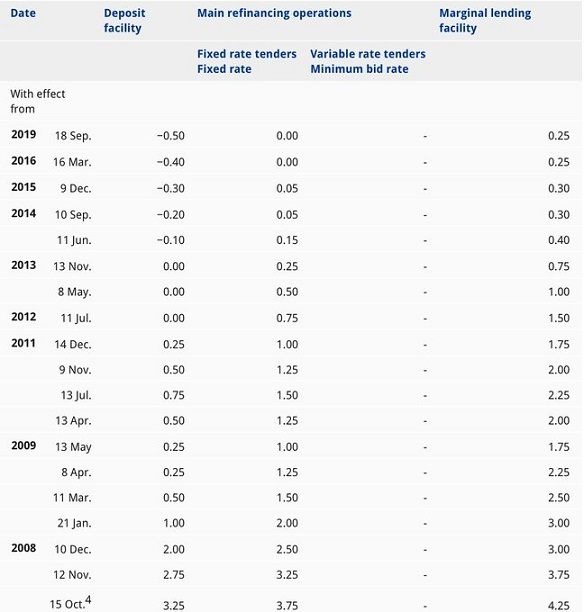
The U.S. Fed Funds rate is at 1.75%-2.00%. The 10-year Treasury yield is at 1.60%. Are quarter point cuts by the Fed going to help much when you’re already stuck in an extremely low rate environment? Can the ECB stimulate much in the way of growth when five-plus years of negative interest-rate policy and massive QE projects are failing?
In a similar vein, it may become more difficult to justify year-over-year contraction in corporate earnings. In 2015-2016, most of the contraction occurred in Big Energy. This time around? We’re seeing a greater dispersion of negative earnings growth, especially in prominent segments like technology.
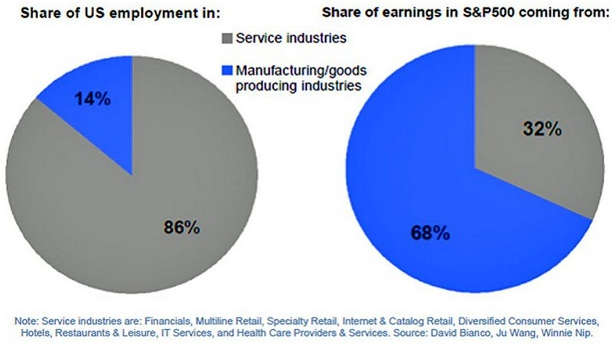
Of course, there are those that argue that manufacturing no longer matters because the U.S. is a service-based economy with service-oriented employment. The problem with the assumption that manufacturing has become irrelevant stateside? Goods producing corporations still account for a massive share of the profits in the S&P 500
Granted, an end to the trade war with China could give a jolt to CEO confidence as well as to the U.S. stock market at large. On the other hand, with the index for New Export Orders (see chart above) all the way down at 41.0, one might want to question whether or not the trade war with China is the only issue. We do not export a whole lot to China and new export orders have nothing to do with tariffs on Chinese products. More likely, the downshift is a reflection of an overall recessionary environment across top economies all around the globe.
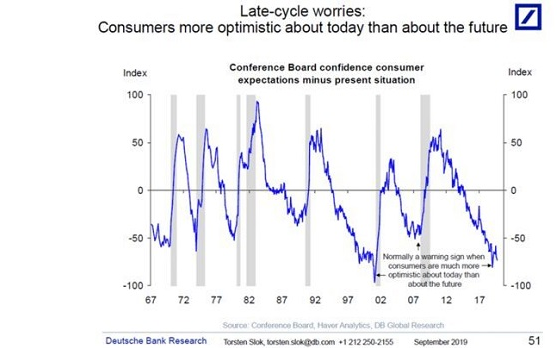
It may be true that consumer resilience is a big reason why the S&P 500 remains within striking distance of all-time records. Yet consider the chart below. Historically, when consumers show far more optimism about the present-day economy than future economic conditions, broad-based recessions are rarely far behind.
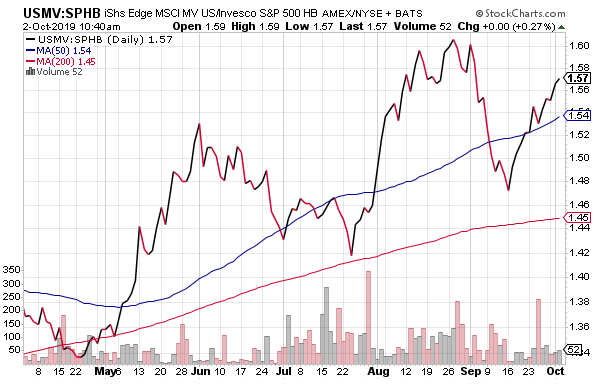
In truth, defensive U.S. stock positioning has been more sensible than aggressive stock positioning for six months already. Consider the rising price ratio for iShares USA Minimum Volatility (USMV:SPHB. It represents a classic late-stage shift in equity positioning.
Are there things that might delay the arrival of a bearish downturn for risk assets? Sure. At least in the near term.
If the Fed abandons a slow-n-steady approach to monetary stimulus, and announces significantly larger cuts to the Fed Funds rate alongside a form of quantitative easing, investors may be encouraged by a “do whatever it takes” approach. Along those lines, Trump could end tariffs outright and choose to strike some sort of deal, removing the overhang of ongoing uncertainty.
Nevertheless, if a broad-based recession is in the works, neither the “Fed put” nor the “Trump put” is likely to prevent a wealth effect reversal. In fact, a wealth effect reversal may come to fruition regardless, ushering in job losses as well as an economic slump.
It’s not that I am abandoning large-cap indexing altogether. On the contrary. It has still proven safer than foreign equity exposure and small cap stock exposure. Yet I have less than I might otherwise have in an early stage bull.
What’s more, I continue to favor defensive investing areas. “Preferreds” and preferred-stock-like debentures have been very fruitful. Treasuries, A-rated quality corporates, and the occasional convertible bond are all possibilities.
High on my list? Annaly Capital Management Inc 6.95% Series F Fixed-to-Floating Rate Cumulative Redeemable Preferred Stock (NLY.PRF). I believe Annaly has been responsibly planning for a late credit cycle well ahead of time. And as I have discussed throughout 2019, VanEck Vectors Preferred Securities ex Financials ETF (NYSE:PFXF) presents a reasonable risk-reward relationship.
I haven’t backed off the capital appreciation potential in the Treasury bond proxy iShares U.S. Treasury Bond ETF (NYSE:GOVT) or the A-rated corporate bond tracker iShares Aaa – A Rated Corporate Bond ETF (NYSE:QLTA). Bonds may be “overvalued” like every other asset in the “Everything Balloon,” but they will gain more ground unless recession fears prove entirely unfounded.
